
Fig. 2.
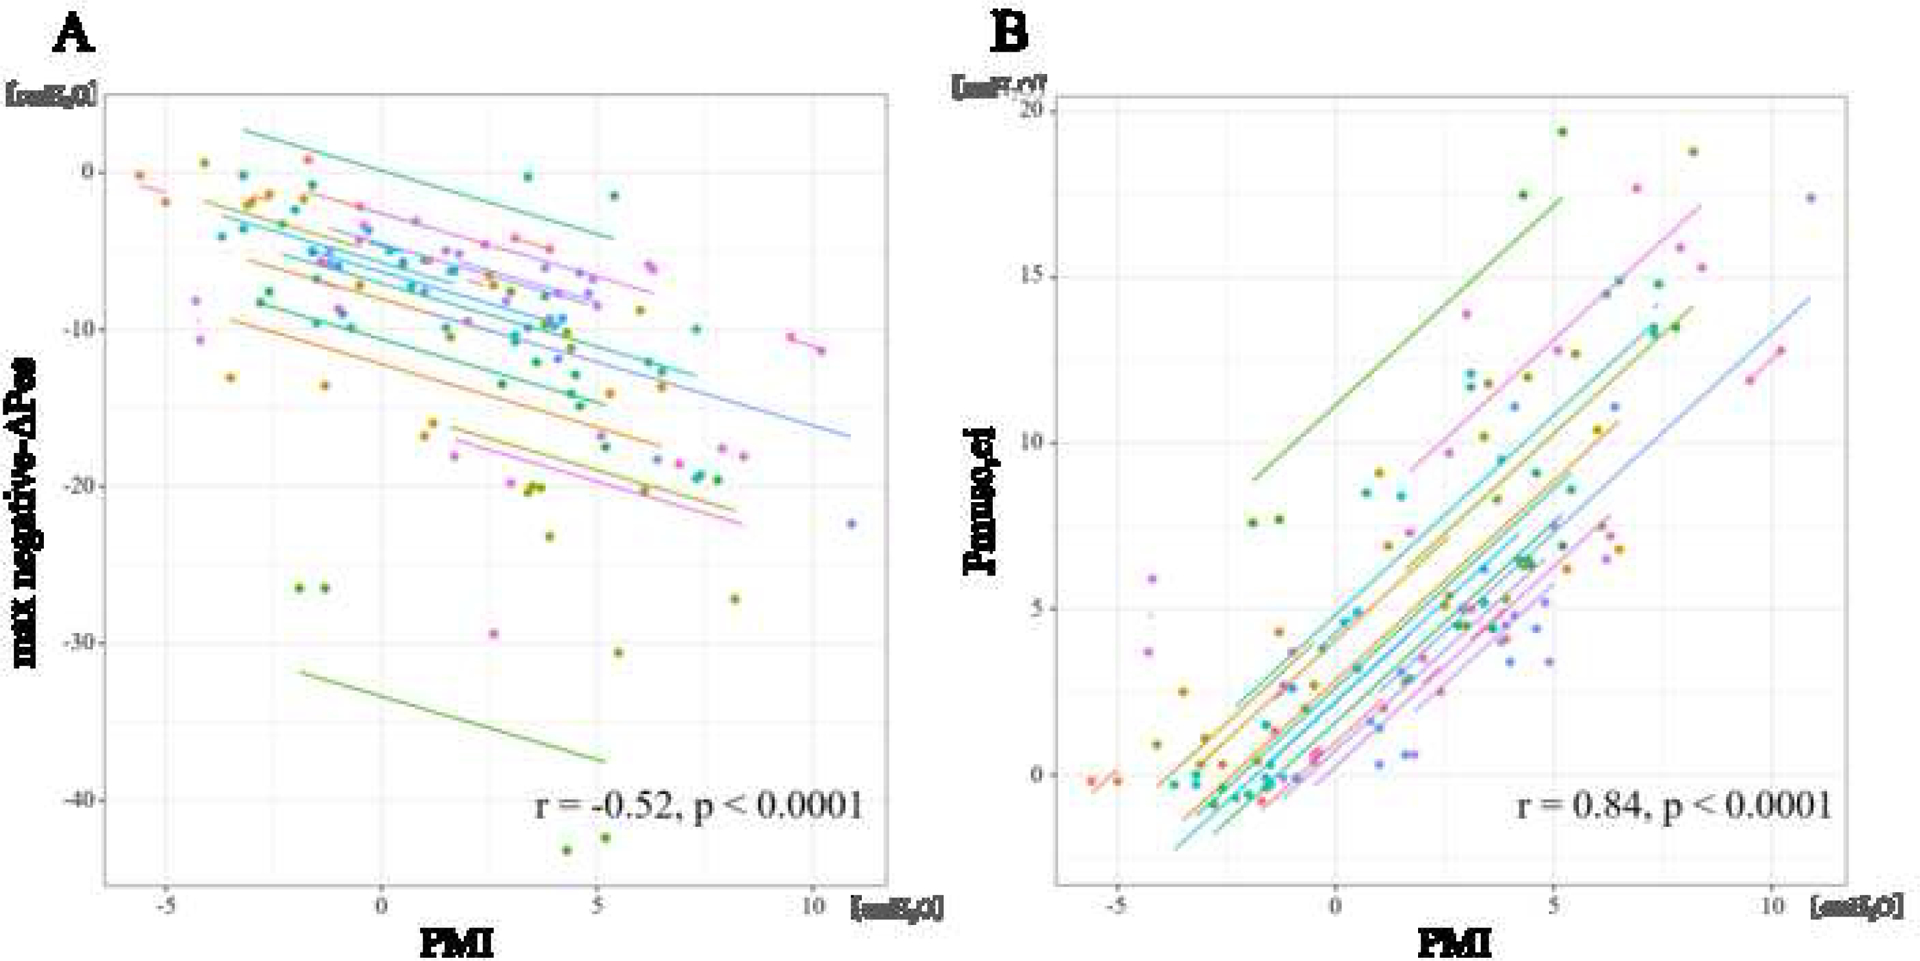
Relationship between Esophageal pressure and PMI.
Scatter plots for the repeated measures correlations (RMCORR) between esophageal pressure derived parameters max negative-ΔPes (resistive and elastic work) (A) and Pmusc,ei (elastic work) (B) and airway pressure derived PMI. Correlation coefficients and adjusted P values are shown in each comparison. For comparison, data from individuals are colored differently, with a single color for all time points from the same individual. The dots represent data for each patient and corresponding lines represent linear relationship for each patient. This technique is needed because repeated measures per patient are possible.