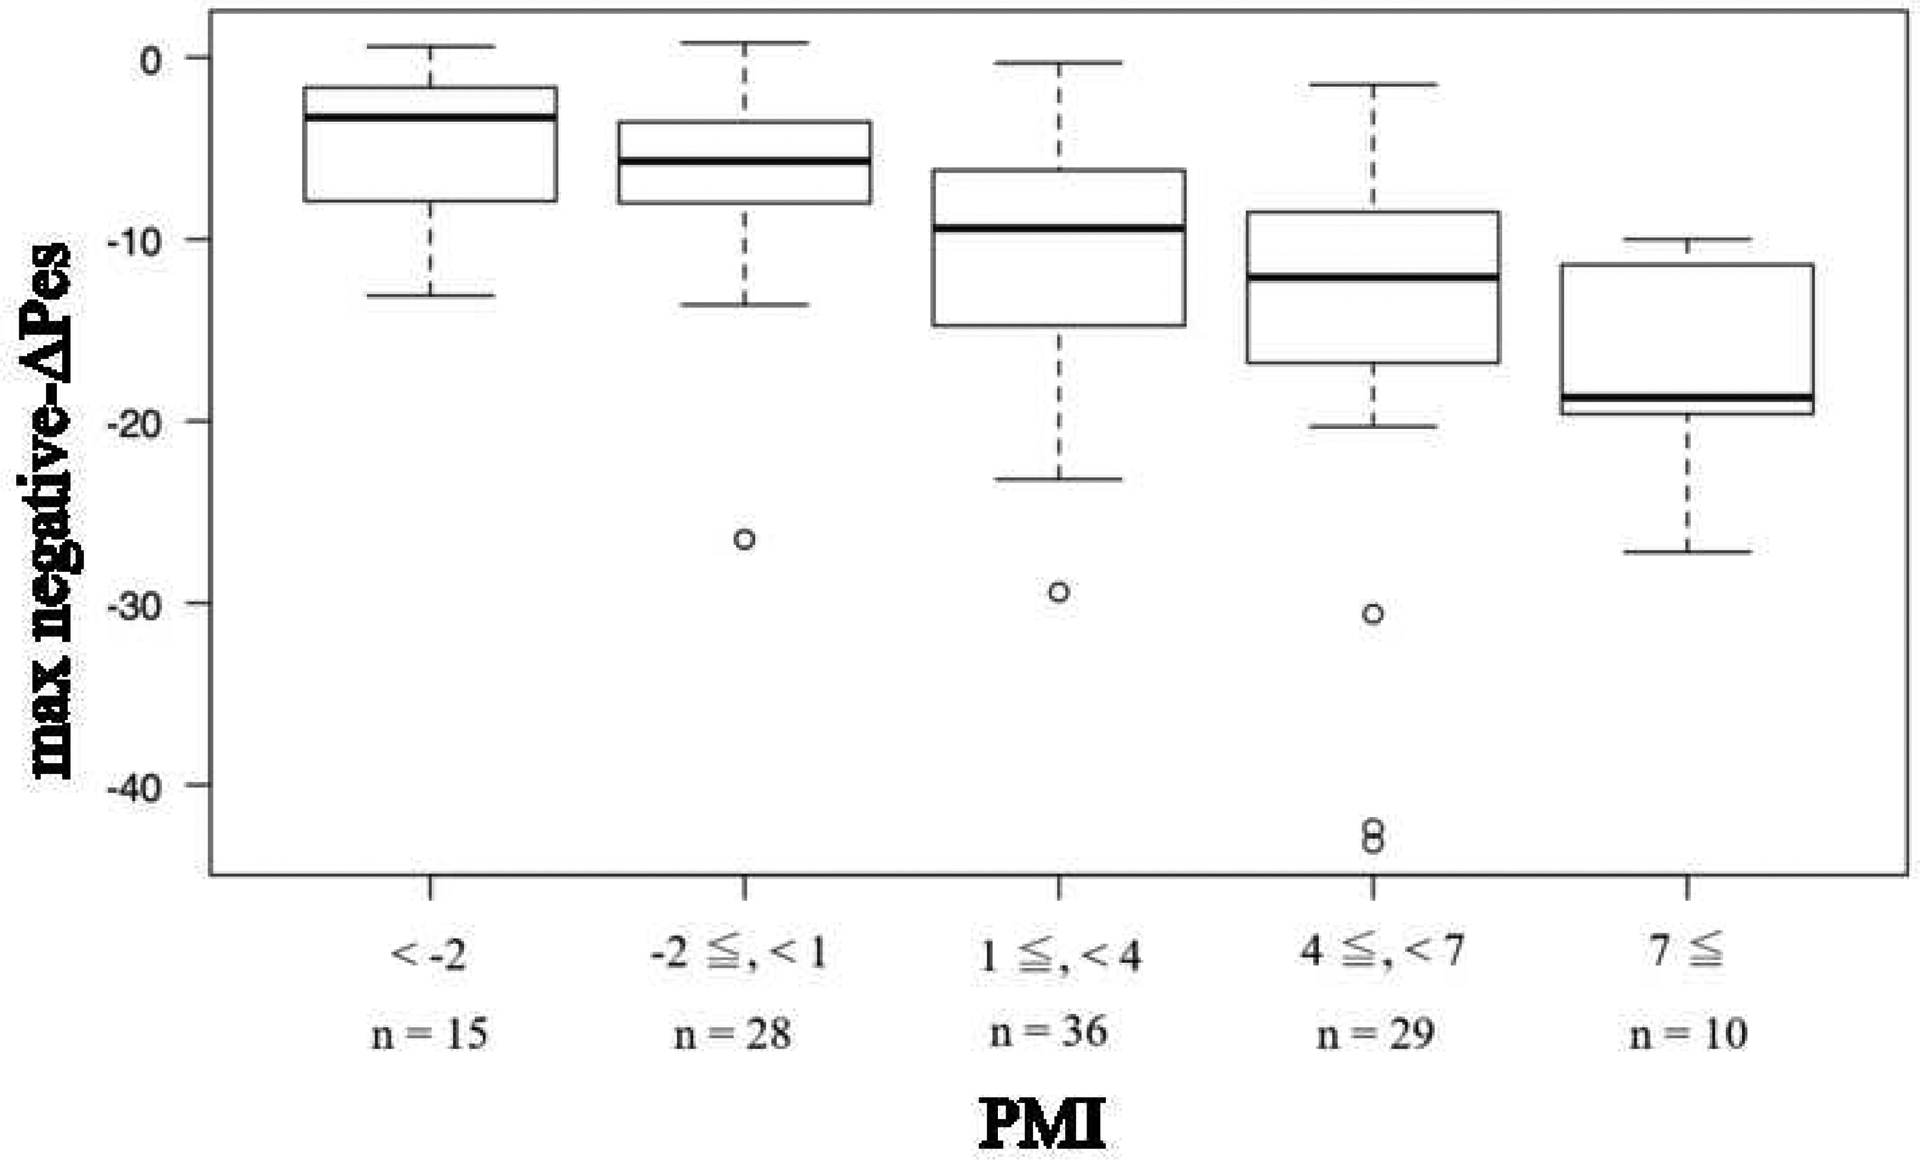
Fig. 3.

The dose-response relationship between PMI and max negative-ΔPes.
When the PMI exceeds 7 cmH2O, the change of Pes is shown to exceed 10 cmH2O.
Bar is median, box is interquartile range, and whisker is nonoutlier range.

The dose-response relationship between PMI and max negative-ΔPes.
When the PMI exceeds 7 cmH2O, the change of Pes is shown to exceed 10 cmH2O.
Bar is median, box is interquartile range, and whisker is nonoutlier range.