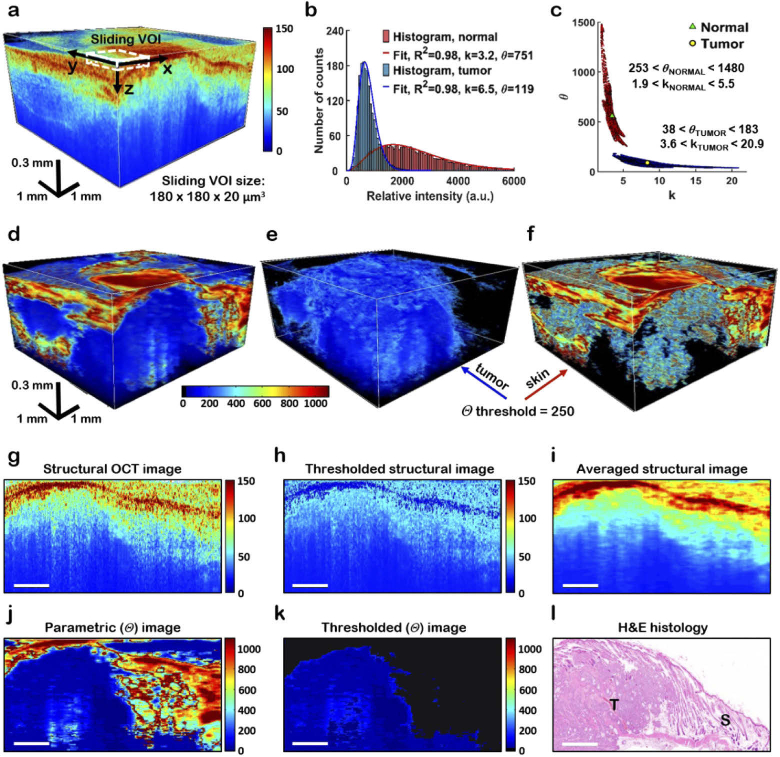
Fig. 3.
BxPC-3 tumor based example of parametric 3D delineation of tumor using a Gamma distribution fit. (a) OCT structural image with sliding volume of interest (VOI) labeled with a white dashed line. Note that for visual representation VOI size in the image is enlarged compared to the actual 180×180×20 µm3 size; (b) Fitting the experimental histogram of VOI voxel intensities with the Gamma distribution [Eq. (1)] to find the fit parameters k and θ. (c) Parametric k versus θ plot from VOIs of 120,000 images of normal and tumor origin obtained from ten (10) mice. In contrast to overlapping k parameter values, θ demonstrates robust separation between normal and tumor regions. Green triangle and yellow circle within the two distributions regions indicate the mean values of k and θ for normal and tumor tissues, respectively; (d) θ parametric volume obtained from the structural 3D OCT image shown in (a), showing excellent tumor delineation. (e) Corresponding 3D segmentation of tumor and (f) normal tissue of the parametric volume shown in (d), θ threshold = 250. (d-f) share the same color bar; (g) 2D structural image, corresponding (h) 25%-%-thresholded and (i) average-filtered structural images, (j) θ parametric image and (k) θ thresholded image, exhibiting much better spatial concordance of the latter with histology (l), and thus demonstrating the accuracy of the Gamma distribution textural analysis compared to tumor / normal tissue separation based on direct thresholding or filtering of the structural image in (g-i). T – tumor, S – skin. Scale bars in (g-l) are 1 mm. (h,i) share the same color bar.

