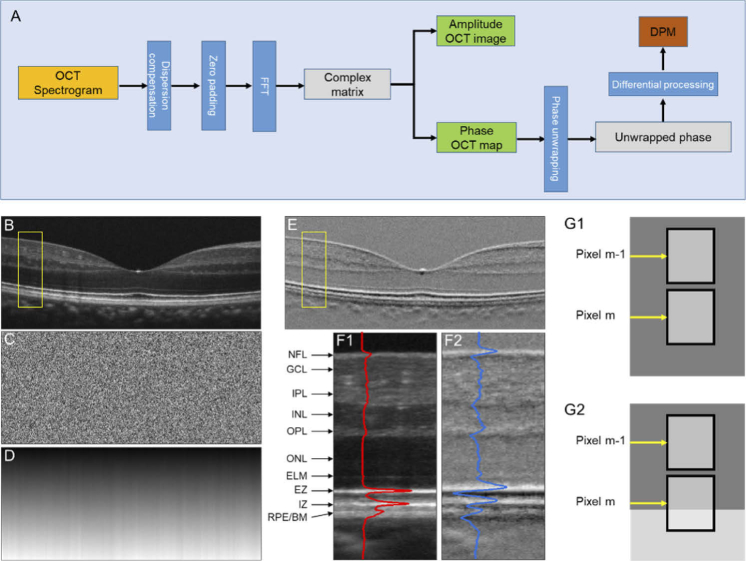
Fig. 1.
(A) A flow chart of amplitude OCT and DPM processing. Representative OCT amplitude image (B), corresponding phase map (C), unwrapped phase map (D), and DPM (E). (F) Flattened amplitude (F1) and DPM (F2) images corresponding to the yellow rectangular areas in (B) and (E). The blue and red curves show the waveform profiles of the amplitude image and DPM. NFL, nerve fiber layer; GCL, ganglion cell layer; IPL, inner plexiform layer; INL inner nuclear layer; OPL, outer plexiform layer; ONL, outer nuclear layer; ELM, external limiting membrane; EZ, ellipsoid zone; IZ, interdigitation zone; RPE, retinal pigment epithelium; BM, Bruch’s membrane. (G) Schematic diagram of differential phase interpretation.

