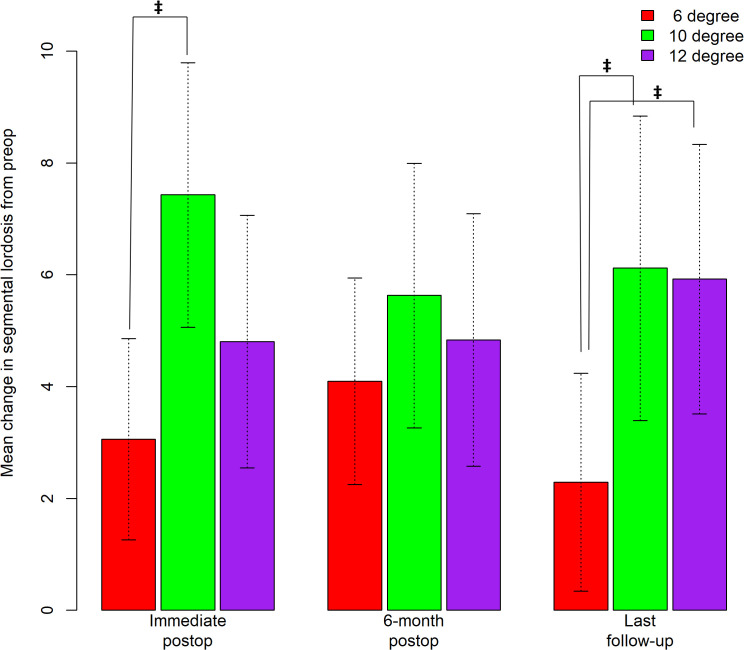
Figure 3.
Bar graph depicting mean change in segmental lordosis (SL) from preop to immediate postop, 6-month postop, and the last follow-up. Error bars correspond to 95% CIs. ‡ indicates statistical significance in increase in mean change in SL from preop to immediate postop between the 6° and 10° cage (3.06° versus 7.43°, p = .0041) and mean change in SL from preop to last follow-up between the 6° and 10° cage (2.30° versus 6.12°, p = .0253) and between the 6° and 12° cage (2.30° versus 5.93°, p = .0219).

