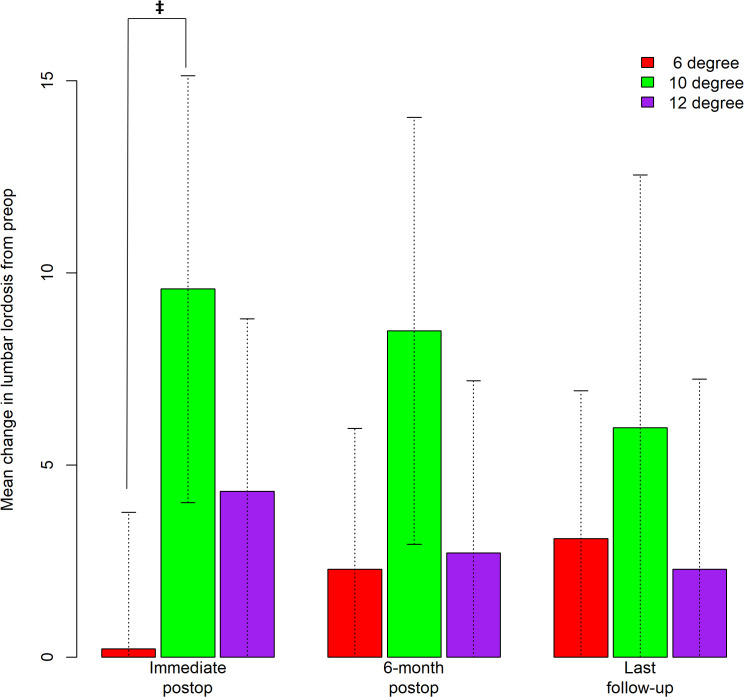
Figure 5.
Bar graph depicting predicted mean change in lumbar lordosis (LL) from preop to immediate postop, 6-month postop, and the last follow-up. Error bars correspond to 95% CIs. Only statistically significant difference exists between the 6° and 10° cohort (0.23° versus 9.58°, p = .0057) at the immediate postop period.

