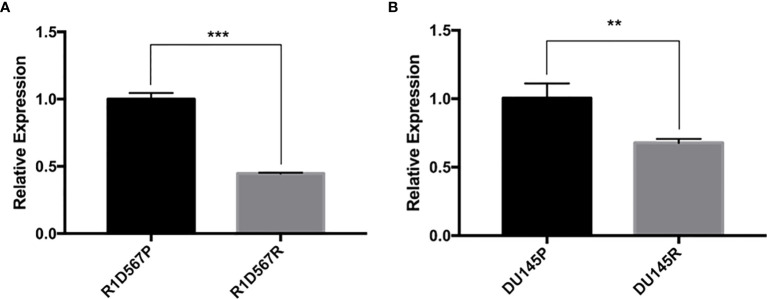
Figure 2.
Docetaxel resistant PCa cell lines exhibit lower GAS5 expression when compared to parent docetaxel sensitive PCa cell lines. The expression was measured using real-time RT-PCR and was normalized to GAPDH expression. (A) Comparison of relative GAS5 expression levels in R1D567 parental line (R1D567P, black bar) and docetaxel resistant line (R1D567R, grey bar). (B) Comparison of relative GAS5 expression levels in DU145 parental line (DU145P, black bar) and docetaxel resistant line (DU145R, grey bar). **P < 0.01, ***P < 0.001.

