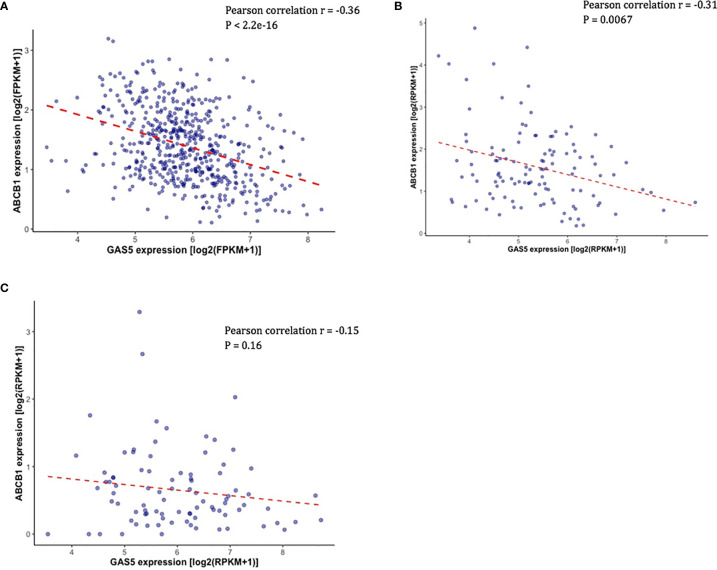
Figure 3.
Validation of the correlation between the expression of GAS5 and the expression of ABCB1 in PCa patient datasets. (A) Scatter plot showing the expression level of ABCB1 (Y-axis) and the expression level of GAS5 in PCa patients in TCGA. (B) Scatter plot showing the expression level of ABCB1 (Y-axis) and the expression level of GAS5 in PCa patients in SU2C. (C) Scatter plot showing the expression level of ABCB1 (Y-axis) and the expression level of GAS5 in PCa patients in PRMOTE.

