Figure 2.

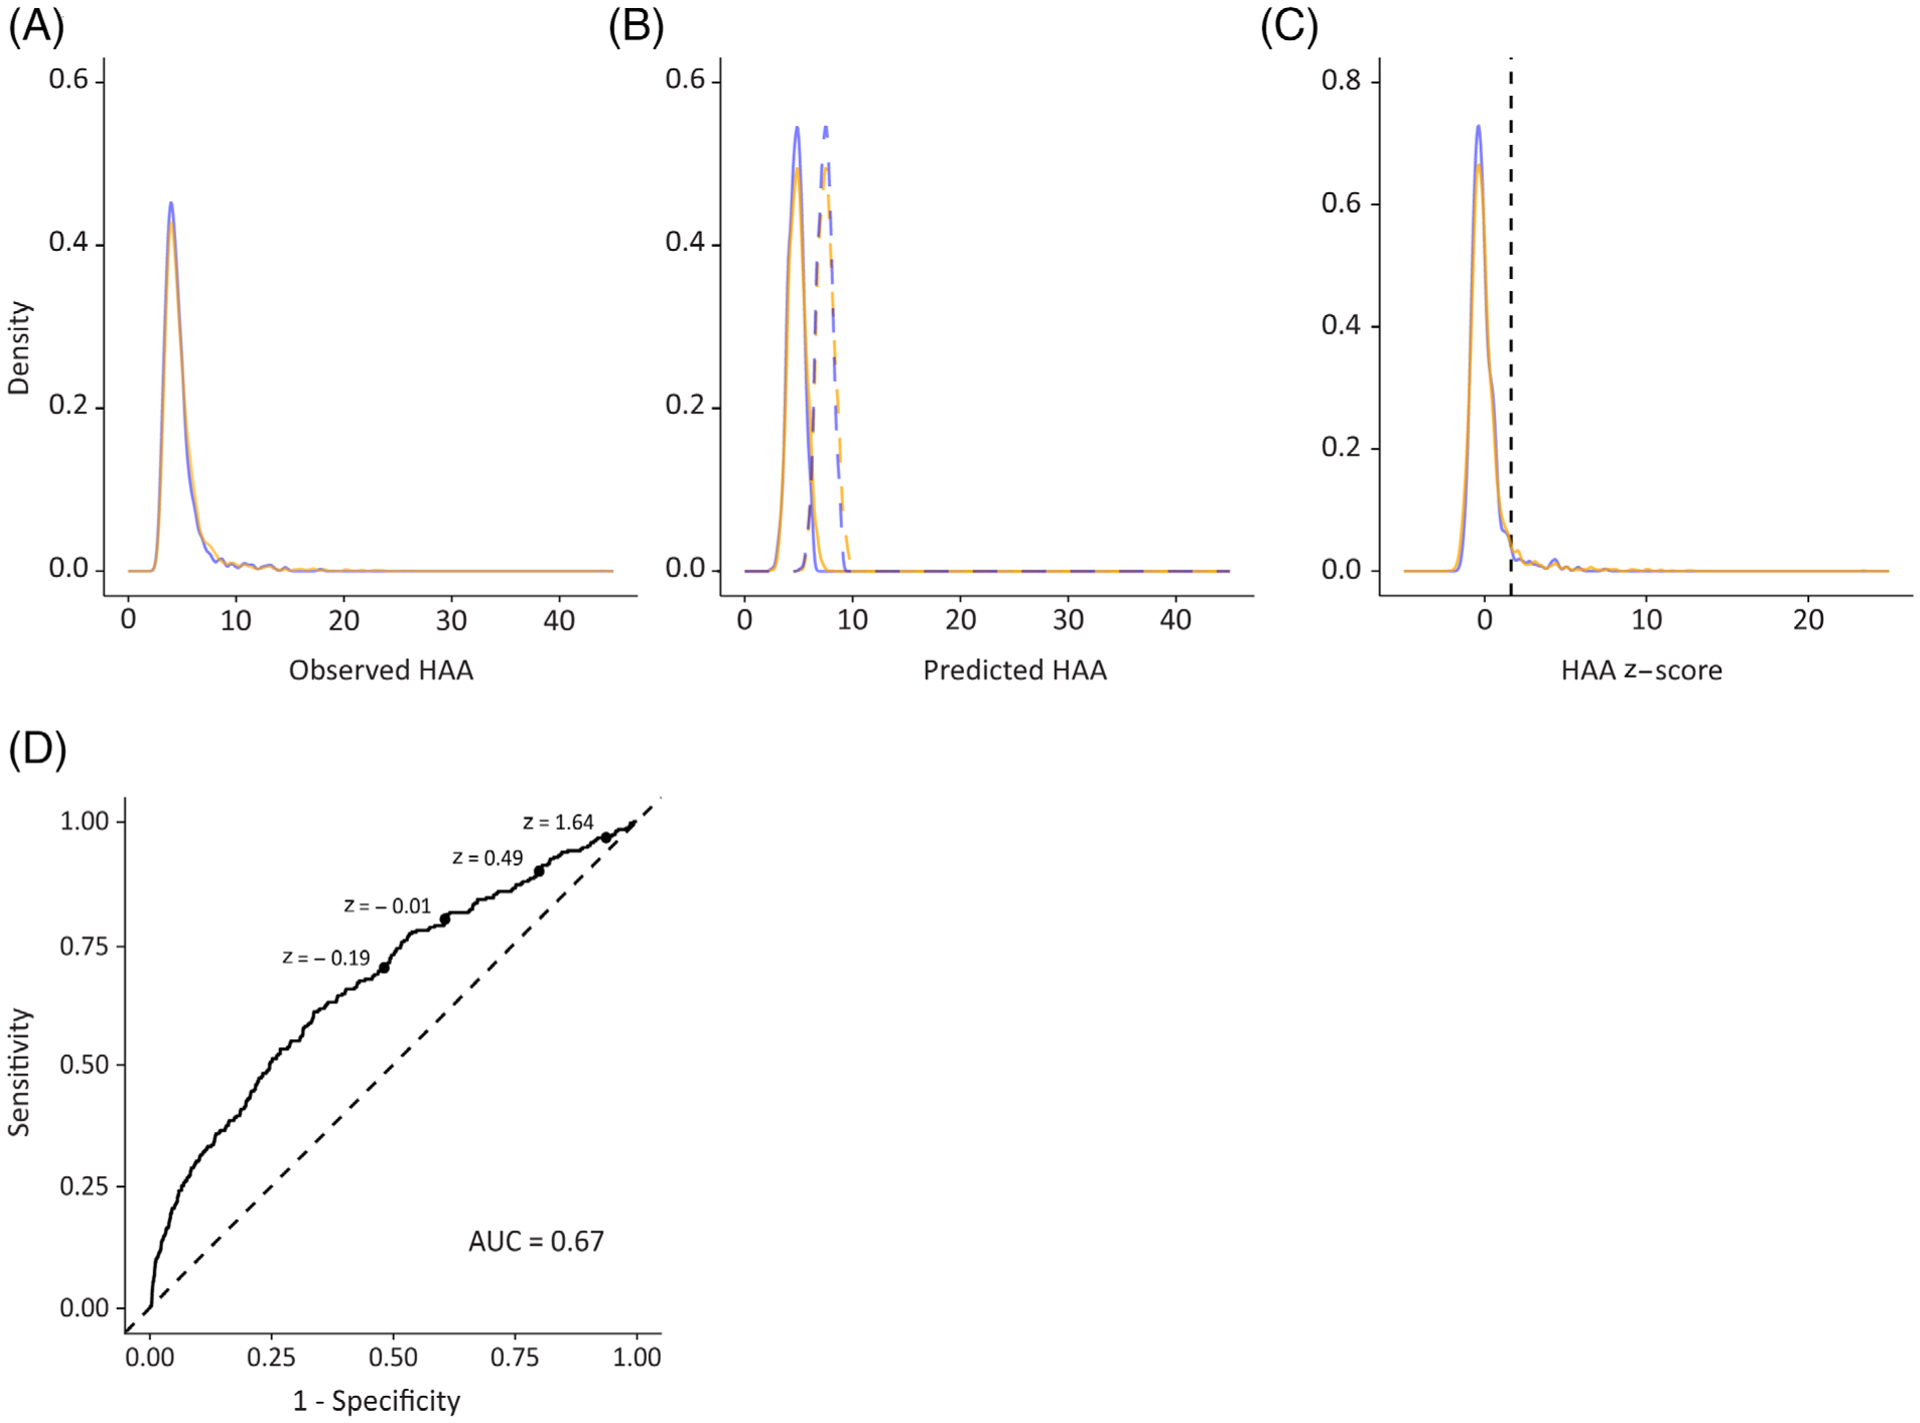
Density plots showing the distribution of: (A) observed HAA values, (B) predicted HAA values (solid) and ULN (dashed) and (C) z-scores (solid) and ULN (z-score = 1.634). Blue denotes the healthy never-smoker subset and orange denotes the complete study sample. (D) ROC curve showing sensitivity versus false positive rate (1 − specificity) for ILA detection for varying elevated HAA threshold values. AUC, area under the curve; HAA, high attenuation area; ILA, interstitial lung abnormality; ROC, receiver operating curve; ULN, upper limit of normal.
