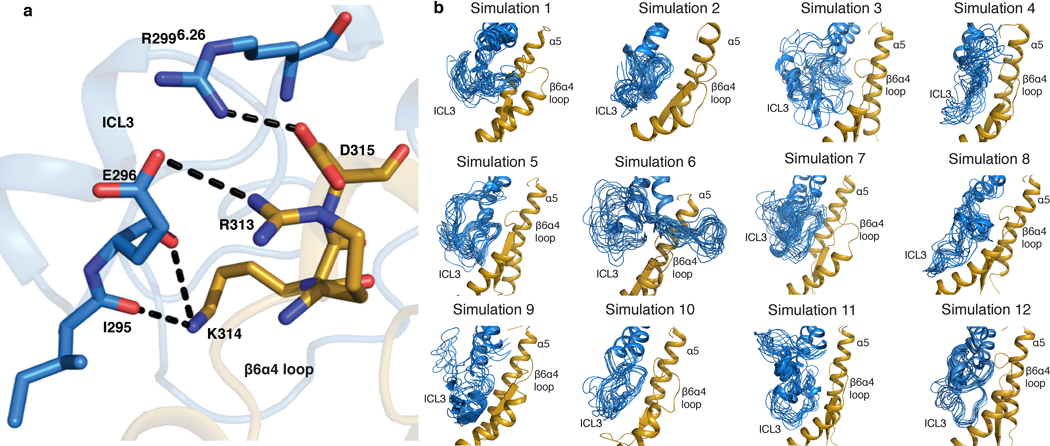
Extended Data Fig. 12 |. Molecular dynamics (MD) simulation for the interaction between ICL3 and the α4β6 loop.
a, MD simulation showing salt bridges and hydrogen bonds form between TM6-ICL3 and α4β6-loop in the canonical state of NTS-NTSR1-Gi-cND represented by simulation 12. b, Dynamics of ICL3 for each independent simulation of the canonical state of NTS-NTSR1-Gi-cND. Frames are sampled every 40 ns from each individual simulation. All 12 simulations show various interactions including salt bridges/hydrogen bonds between ICL3 and the α4β6-loop. An example of detailed interactions is shown in (a). NTSR1 is colored in blue and Gi in gold in (a-b).

