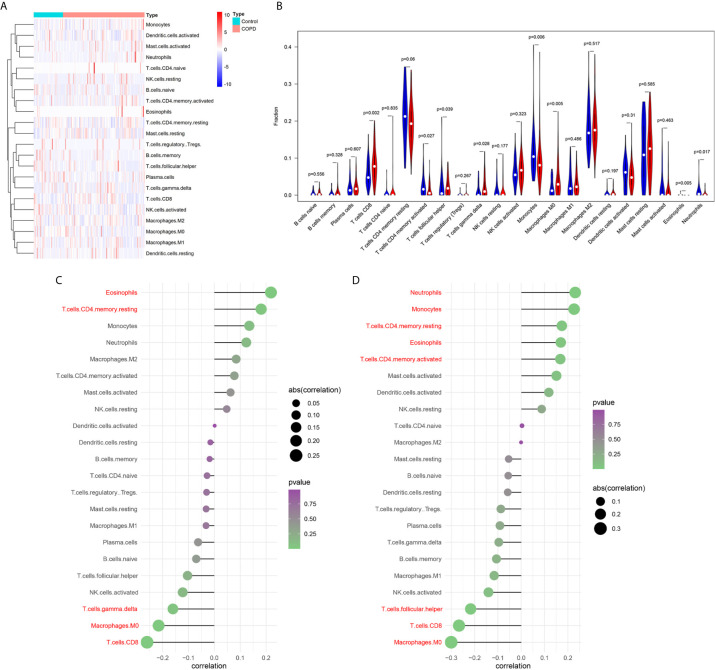
Figure 2.
Analysis of immune landscape associated with COPD. Heatmap (A) and violin plot (B) showing the distribution of 22 types of immune cells in normal smoker and COPD patients in GSE76925; (C) The relationship between FVC% predicted and immune cell infiltration level; red: statistically significant (P < 0.05); (D) The relationship between FEV1/FVC and immune cell infiltration level; red: statistically significant (P < 0.05).

