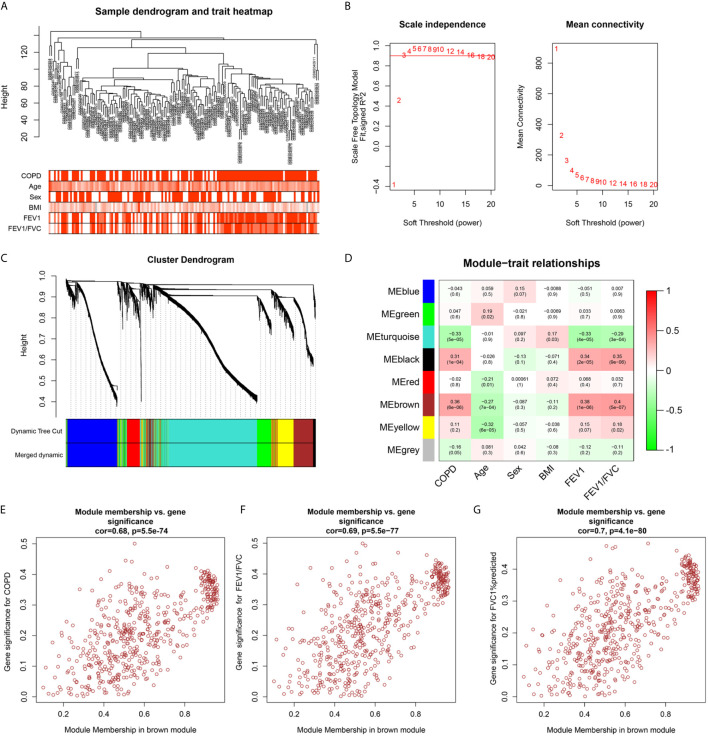
Figure 3.
Weighted co-expression network analysis. (A) Sample dendrogram and trait heat map; (B) Analysis of the scale-free fit index (left) and the mean connectivity (right) for various soft-thresholding powers; (C) Clustering dendrograms of genes based on a dissimilarity measure (1-TOM); (D) Module-trait associations were evaluated by correlations between module eigengenes and sample traits. (E–G) Scatterplot of Gene Significance for COPD, FEV1/FVC, FEV1% predicted vs. Module Membership in brown module.

