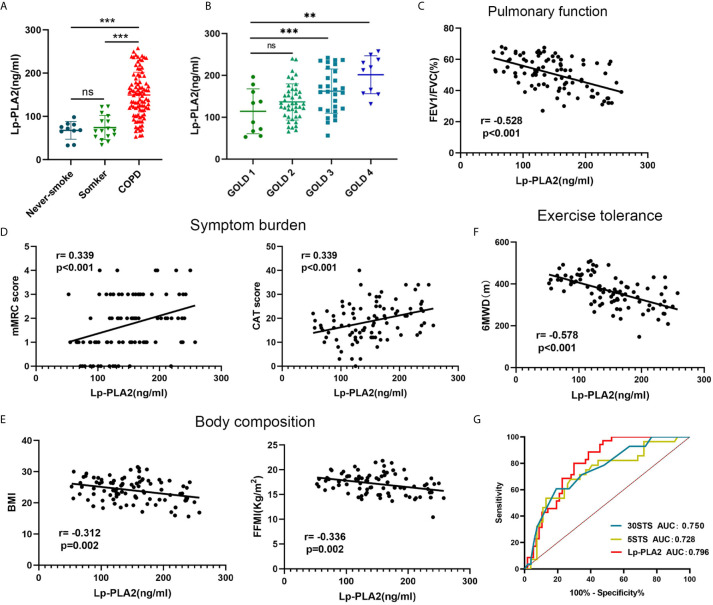
Figure 6.
The clinical value of Lp-PLA2 level for COPD patients. (A) Lp-PLA2 level in serum tended to be higher in COPD patients than healthy smokers; (B) Lp-PLA2 level increase along with GOLD stage; (C) Lp-PLA2 level was negative correlate with FEV1/FVC (r=-0.528, p<0.001); (D) Lp-PLA2 level was positive correlate with mMRC score (r=0.339, p<0.001) (left) and CAT score (r=0.339, p<0.001) (right); (E) Lp-PLA2 level was negative correlate with BMI (r=-0.312, p=0.002) (left) and FFMI (r=-0.336, p=0.002) (right); (F) Lp-PLA2 level was negative correlate with 6MWD (r=-0.578, p=0.002); (G) ROC curve analysis of the Lp-PLA2 level, the 5STS score and the 30STS score for predicting 6MWD <350 m. ns, not statistically significant, **P < 0.01 and ***P < 0.001.

