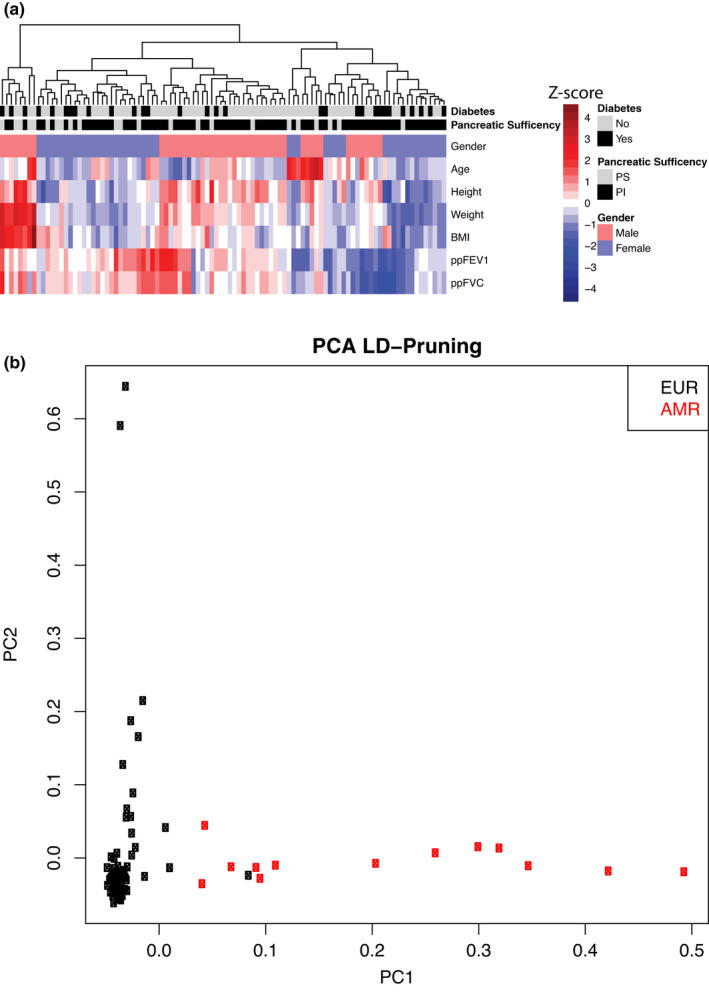
FIGURE 1.

Population structure of the set of Cystic Fibrosis subjects available for analysis. (a) Hierarchical clustering of patient phenotype (scaled Z‐score). Data indicate a strong dependence on gender and lung function phenotypes. There are also areas where lung function does not correlate with nutritional indicators. (b) Principal component analysis showing patient differentiation based on LD pruning of 30% threshold and 750 k base pairs. This is the part of the strategy for simplifying the population
