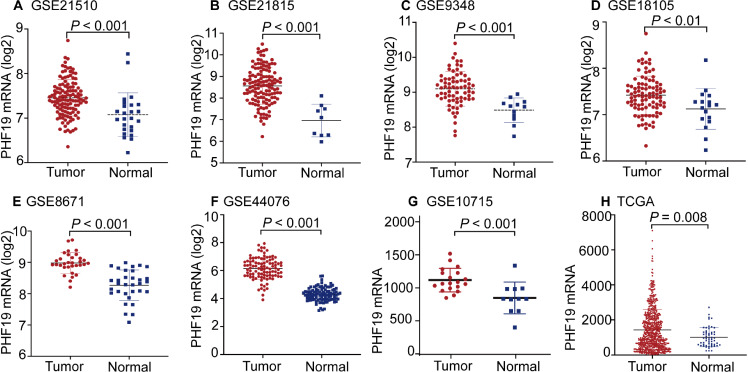
Figure 1. PHF19 mRNA expression levels between tumor and normal tissues in CRC patients in GEO database series and TCGA-COADREAD database.
PHF19 mRNA expression levels between tumor and normal tissues in CRC patients in GEO database series including GSE21510 (A), GSE21815 (B), GSE9348 (C), GSE18105 (D), GSE8671 (E), GSE44076 (F), GSE10715 (G), and the TCGA-COADREAD database (H).

