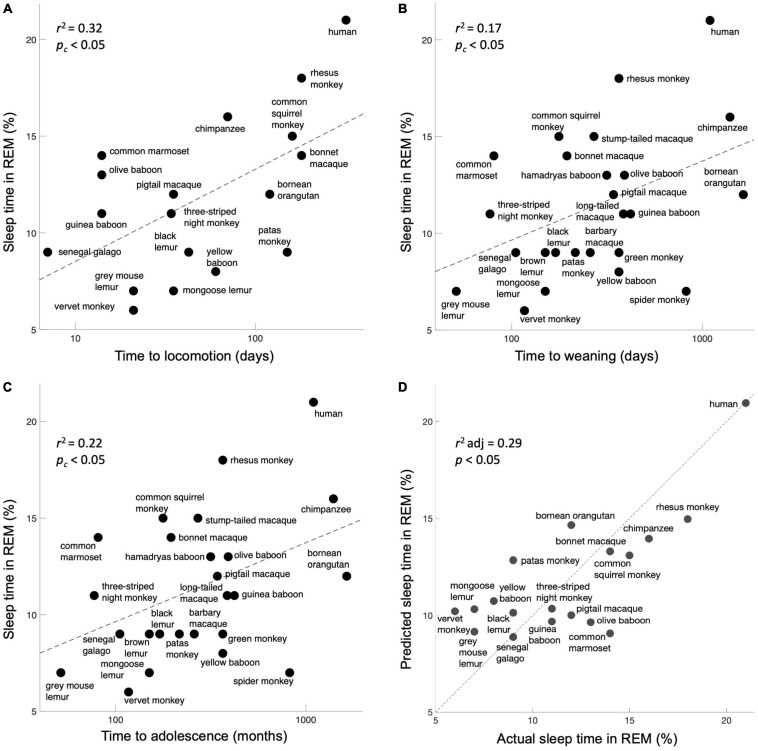
FIGURE 2.
Expressions of plasticity correlate with the percentage of sleep time spent in REM. (A) Time to locomotion. (B) Time to weaning. (C) Time to adolescence. Although these are crude correlates of neuroplasticity, they map significantly onto the fraction of REM sleep, as per the prediction. (D) A model incorporating all three behavioral measures of plasticity significantly predicts the percentage of sleep time spent in REM. The unity line signifies the perfect model prediction.

