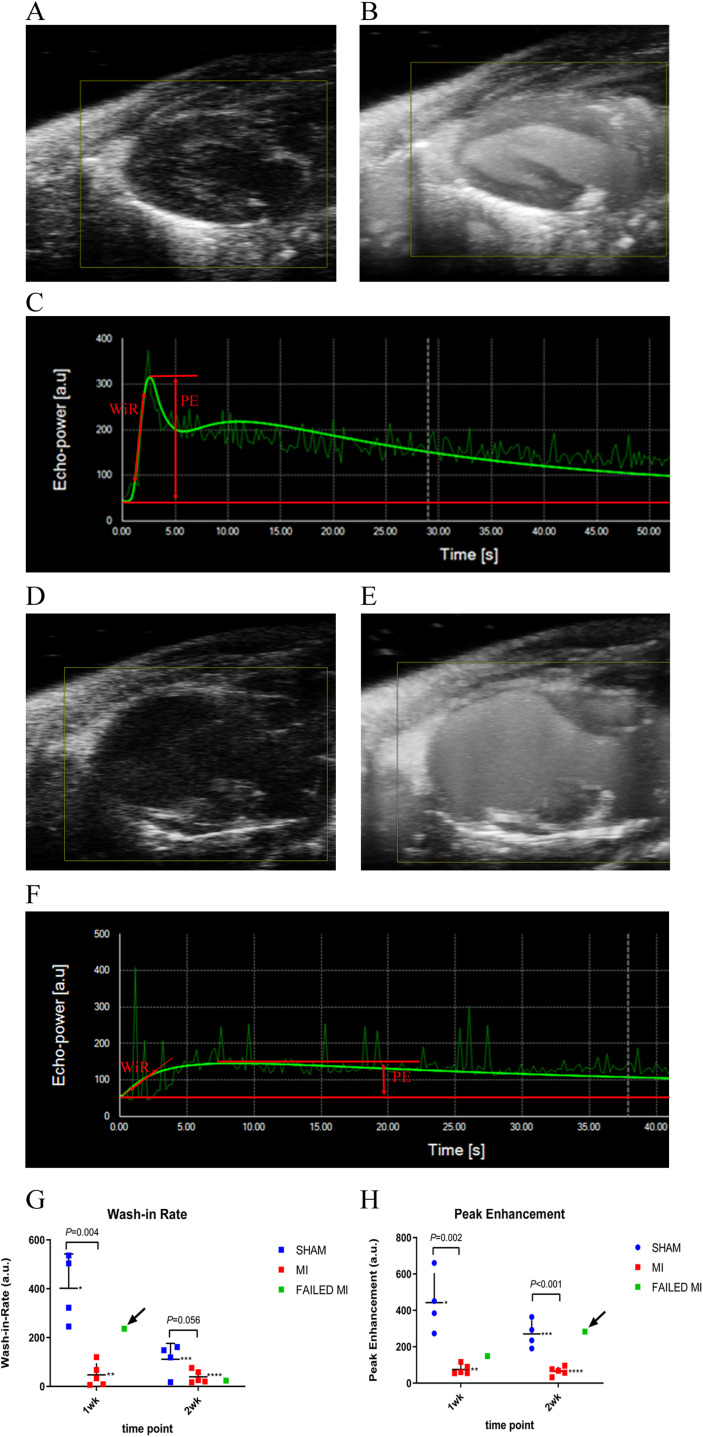
Figure 1. Example ultrasound images of the 2D PLAX view of the left ventricle at multiple stages during the process of microbubble injection.
(A) 2D B-Mode PLAX of the left ventricle pre-microbubble injection in a sham-operated animal. (B) 2D PLAX post-microbubble injection of sham-operated animal as an MIP image, which shows the total accumulation of microbubbles over a period of time to better display the distribution of microbubbles in the myocardium. (C) Kinetic graph of the non-linear contrast (NLC) signal of microbubble arrival and plateau in VevoCQ software of a sham-operated animal upon microbubble injection. Locations where WiR and PE were derived from are approximated with red markings. (D) 2D B-Mode PLAX of the left ventricle pre-microbubble injection in an MI animal. (E) 2D B-Mode PLAX post-microbubble injection of an MI animal as MIP image. (F) Kinetic graph of the NLC signal of microbubble arrival and plateau in VevoCQ software of MI animal upon microbubble injection. Locations where WiR and PE were derived from are approximated with red markings. (G) Scatter plot of individual data points for the WiR calculated from the slope of the microbubble arrival kinetics in panels C and F. Data represents 1-week and 2-week cohorts of sham-operated animals (blue, n = 4), MI animals (red, n = 5), and failed MIs (green) with arrows indicating if they were able to be differentiated from the MI cohort. The failed MIs were excluded from mean data calculations. *401.86 ± 140.44, **70.32 ± 95.92, ***111.30 ± 65.12, ****39.27 ± 26.07. (H) Scatter plot of individual data points for the PE calculated from the plateau of the microbubble arrival kinetics in panels C and F. Data represents sham-operated animals (blue, n = 4), MI animals (red, n = 5), and failed MIs (green) with arrows indicating if they were able to be differentiated from the MI cohort. The failed MIs were excluded from mean data calculations. *442.29 ± 163.00, **75.08 ± 27.23, ***270.39 ± 75.01, ****65.68 ± 23.61. MCE, myocardial contrast echocardiography; MI, myocardial infarction; PLAX, parasternal long axis; MIP, maximum intensity projection; NLC, non-linear contrast; PE, peak enhancement; WiR, wash-in-rate.

