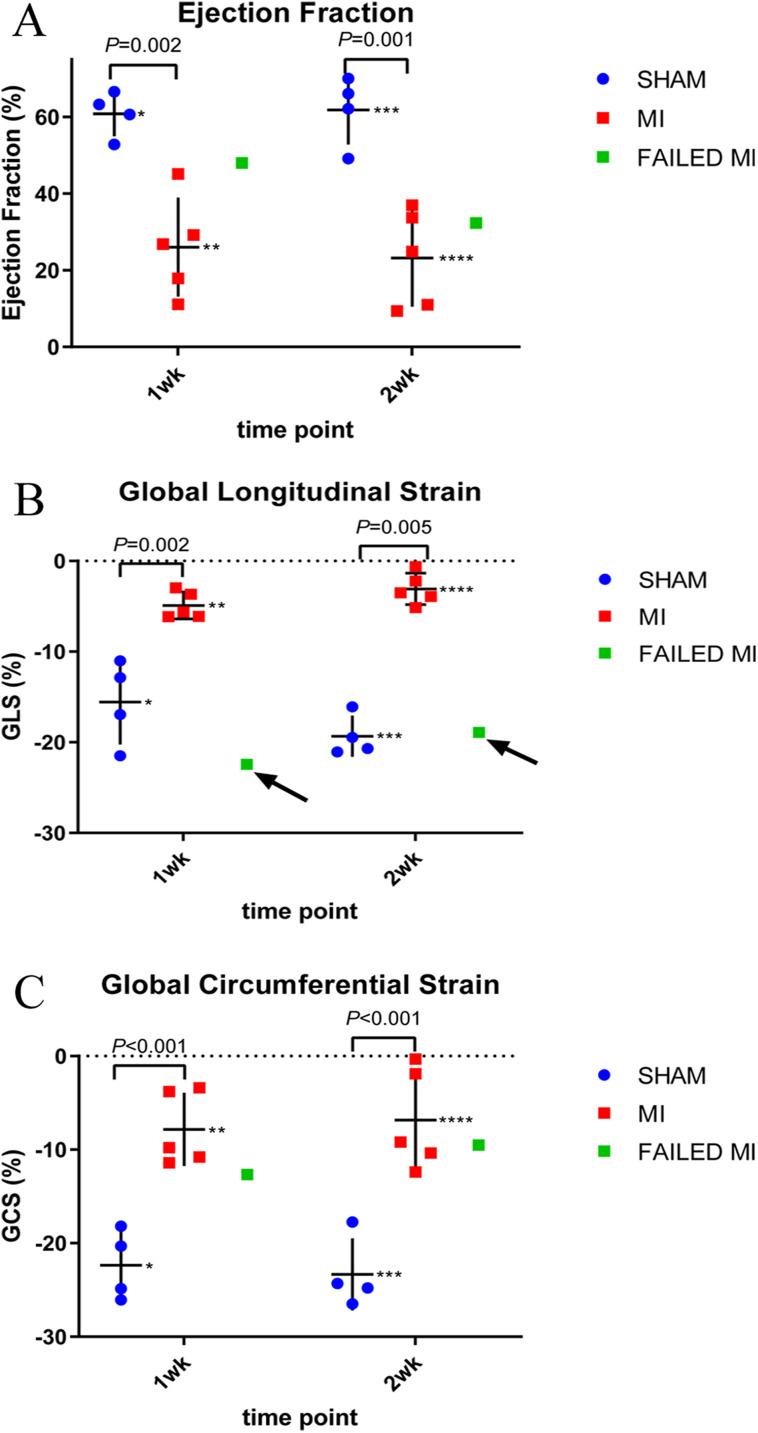
Figure 4. Scatter plots of individual animal data from conventional echocardiogram techniques of MI (red, n = 5), sham-operated (blue, n = 4), and failed MI animals (green) in 1-week and 2-week cohorts.
The arrows indicate when a failed MI was able to be differentiated from the MI cohort. Failed MIs were not included in mean data calculations. (A) Represents the EF calculated from standard M-Mode. * 60.86 ± 5.86, ** 26.05 ± 12.89, *** 61.87 ± 9.06, **** 23.20 ± 12.66. (B) Represents the GLS as calculated from 2D strain analysis. *−15.57 ± 4.86, **−4.90 ± 1.48, ***−19.33 ± 2.27, ****−3.08 ± 1.73. (C) GCS as calculated from 2D strain analysis. *−22.35 ± 3.71, **−7.83 ± 3.92, ***−23.33 ± 3.85, ****−6.83 ± 5.38. MI, myocardial infarction; M-Mode, motion-mode; EF, ejection fraction; GLS, global longitudinal strain; GCS, global circumferential strain.

