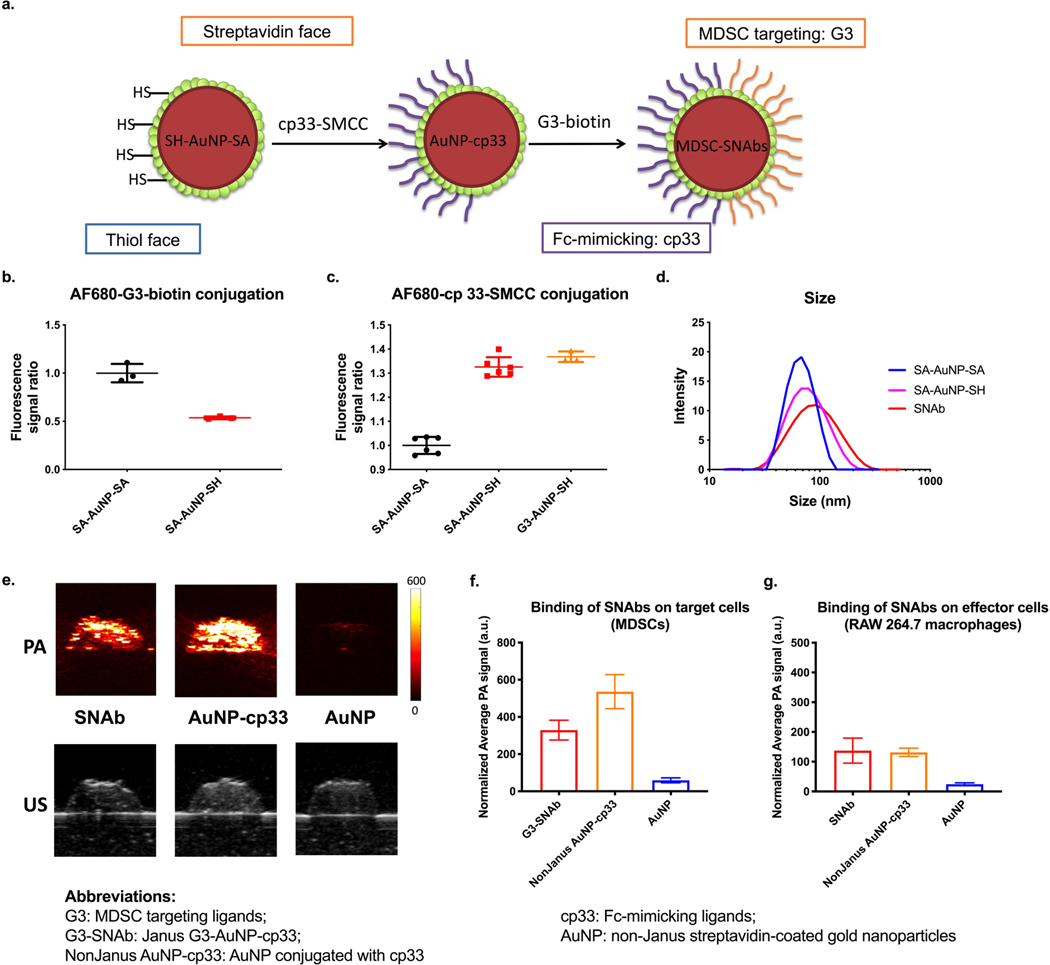
Figure 3.
Ligand modification on Janus Au nanoparticles and evaluation of the binding of SNAbs onto mouse MDSCs and macrophages by photoacoustic (PA) imaging. (a) Following fabrication of Janus nanoparticles, the Fc-mimicking ligands, cp33, was conjugated onto the thiol face of the Janus nanoparticles via thiol-maleimide reaction, and the targeting ligands, G3, was modified onto the streptavidin face via biotin-streptavidin interaction. (b,c) Alexa Fluor 680-NHS-estertagged MDSC-targeting peptide (G3) and Alexa Fluor 680-NHS-ester-tagged Fc-mimicking peptide (cp33) were reacted with SA-AuNP-SH or SA-AuNP-SA. The conjugation level of each peptide was assessed by measuring fluorescence of the samples and normalizing against nanoparticle concentrations. Background fluorescence of the untagged-peptide-modified nanoparticles was subtracted from the measured values of the samples. Data are presented as mean ± s.d. N=2 (left) or 3 (right) independent samples with n=3 or n=6 technical replicates. (d) Hydrodynamic sizes of nonJanus SA-AuNP-SA, Janus nanoparticles SA-AuNP-SH and SNAbs after modification with ligands were measured by dynamic light scattering on a Malvern Zetasizer. (e) The photoacoustic (PA) and ultrasound (US) images of nanoparticle-treated samples of mouse MDSCs. Top: PA images of the cell inclusions of SNAb, NonJanus AuNP-cp33, NonJanus AuNP-cp33 and AuNP at a wavelength of 532 nm. Bottom: US images of the cell inclusions of SNAb and AuNP. (f,g) The relative amount of nanoparticles bound to mouse MDSCs (f) or RAW 264.7 macrophages (g) based on the average PA signals of each cell inclusion (0.5 million cells/40𝜇L). PA signals shown in the graphs were normalized against the laser energy and backscattered ultrasound signals. Data are presented as mean ± s.d. of at least six cross-section images of two or more technical replicates of corresponding independent samples.

