Figure 5.
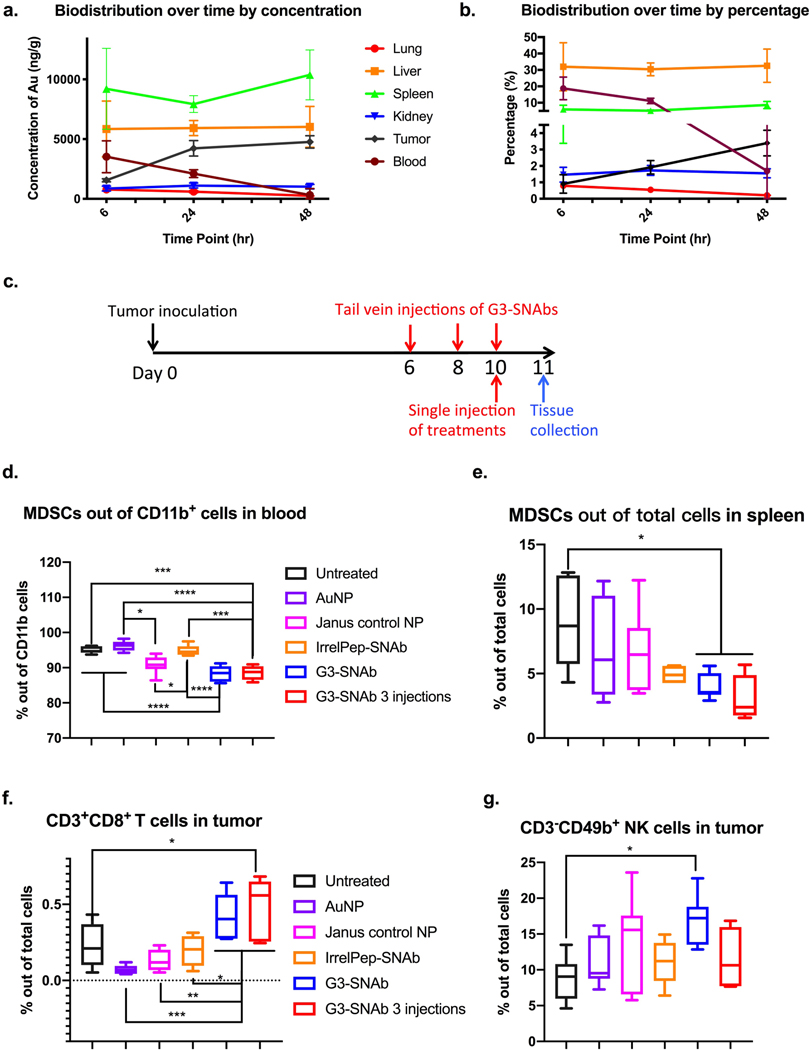
Biodistribution and therapeutic effects of MDSC-SNAbs in a 4T1 mouse breast cancer model. (a,b) Biodistribution of SNAbs after intravenous injection in tumor-bearing mice. G3-SNAbs were administered through tail vein injection on day 9 post tumor inoculation. Lung, liver, spleen, kidney, tumor and blood were harvested after 6, 24, or 48 hours for ICP-MS analysis. Changes in the biodistribution over time, presented as concentration of Au per ug of tissue (a) and calculated percentage of SNAbs in each organ out of total injected amount of nanoparticles (b), were plotted with mean ± s.d. of 3 biological samples (n = 3). (c-g) Therapeutic effects of MDSCs in the 4T1 murine model. (c) The schedule of tumor inoculation and systemic injection (i.v. via the tail vein) of G3-SNAbs (Janus G3-AuNP-cp33), IrrelPep-SNAb (Janus scAHNP-AuNP-cp33), Janus control NP (Janus biotin-AuNP-NEM), AuNP and PBS (n=7, 7.5×10¹⁰/20𝜇L per injection). The percentage of total MDSCs (PMN-MDSCs and M-MDSCs) out of total cells in the blood (d) and spleens (e), the percentage of CD3+CD8+ cytotoxic T cells (f) and CD3-CD49b+NK cells (g) infiltrated in the tumors after treatment on day 11 are presented in box plots with box showing median, 25 and 75 percentile and whiskers showing min and max. After removing outliers, n=6 for untreated groups, n=6 in (d) and n=7 in (e) and (f-g) for AuNP group, N=7 for Janus control NP, n=4 in (e) and (g), n=5 in (d) and n=6 in (f) for IrrelPep-SNAb group, and n=7 for G3-SNAb single injection group, n=4 in (d),(e),(g) and n=5 in (f) and for G3-SNAb 3-injection groups. Significance was determined using one-way ANOVA with Tukey post-hoc test (**** p<0.0001, *** p<0.0002, ** p<0.0021, * p<0.0332).

