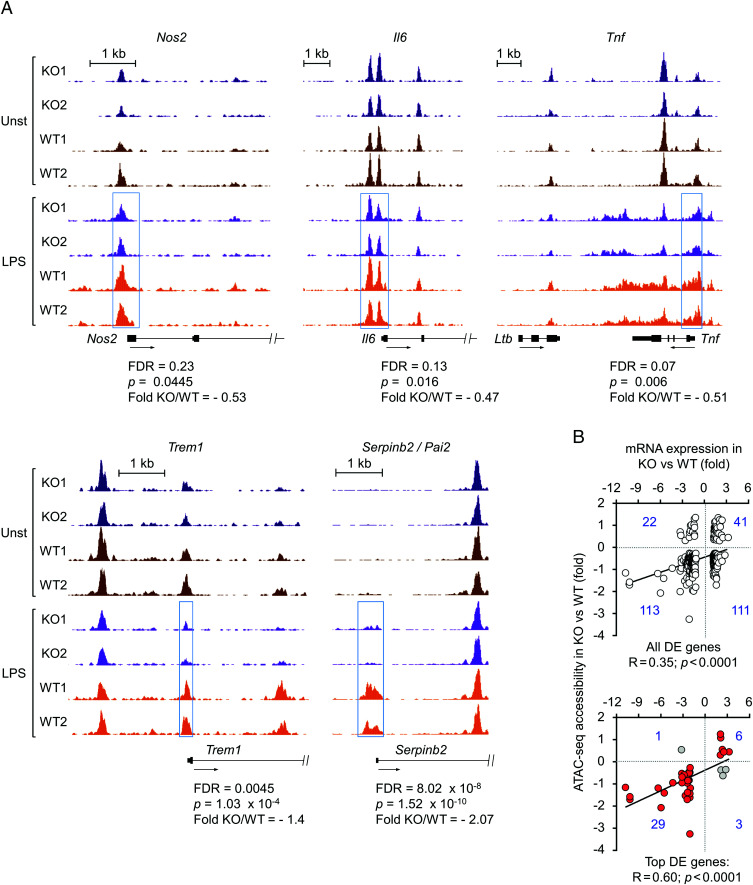
FIGURE 4.
Reduced chromatin accessibility in gene promoters of NFAT5-deficient macrophages. (A) Genome browser snapshots showing the ATAC-seq signals in promoter regions of NFAT5-induced genes (Nos2, Il6, Tnf, Trem1, Serpinb2). Regions differentially accessible between LPS-treated wild-type and NFAT5-deficient macrophages are highlighted by blue boxes. False discovery rate (FDR), fold change, and statistical significance of differential accessibility between LPS-stimulated wild-type and NFAT5-deficient macrophages for the respective regions are indicated. (B) Comparison of chromatin regions differentially accessible (ATAC-seq) with transcriptomic analysis of gene expression between LPS-stimulated wild-type and NFAT5-deficient macrophages (GSE26343). The upper panel shows all genes identified in the microarray analysis for which differentially accessible regions were identified in the ATAC-seq. The bottom panel shows the subset of genes with >2-fold expression difference between wild-type and NFAT5-deficient macrophages. Genes showing a direct correlation between expression and chromatin accessibility are marked in red in the bottom panel (see also Supplemental Table I for the respective lists of genes: ATAC versus RNA top DE genes and ATAC versus RNA all DE genes).

