
Figure 1.
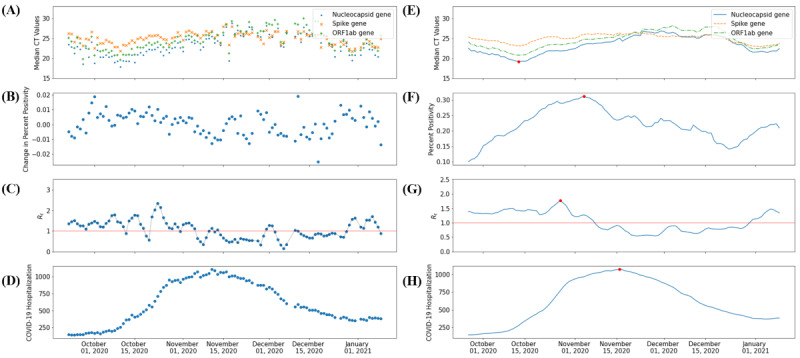
(A) Daily median CT values for SARS-CoV-2 positive samples. (B) Daily change in percent positivity for SARS-CoV-2 detection. (C) Daily SARS-CoV-2 Rt. (D) Daily count of hospitalized individuals with COVID-19. (E) The 7-day rolling average of the daily median CT values for SARS-CoV-2–positive samples. (F) The 7-day rolling average of percent positivity rates for SARS-CoV-2–positive samples. (G) The 7-day rolling average of daily SARS-CoV-2 Rt values. (H) The 7-day rolling average of the number of hospitalized individuals with COVID-19 in the greater El Paso area between September 15, 2020, and January 11, 2021. The red lines in graphs C and G signify an Rt value of 1. Red dots represent the global minimum for smoothed CT values and global maxima for smoothed epidemiological indicators. CT: cycle threshold; ORF1ab: open reading frames 1ab; Rt: transmission rate.