
Figure 2.
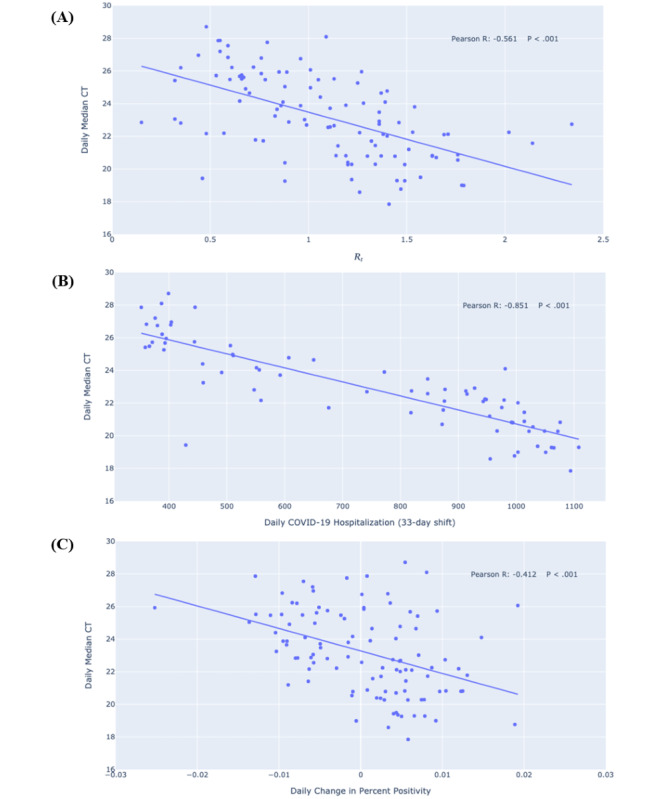
Linear regressions and scatter plots of (A) daily median CT values for SARS-CoV-2–positive samples versus daily transmission rate SARS-CoV-2 Rt, (B) daily numbers of hospitalized individuals with COVID-19, and (C) daily changes in percent positivity for SARS-CoV-2 detection in the greater El Paso area between September 15, 2020, and January 11, 2021. CT: cycle threshold; Rt: transmission rate.