
Figure 2.
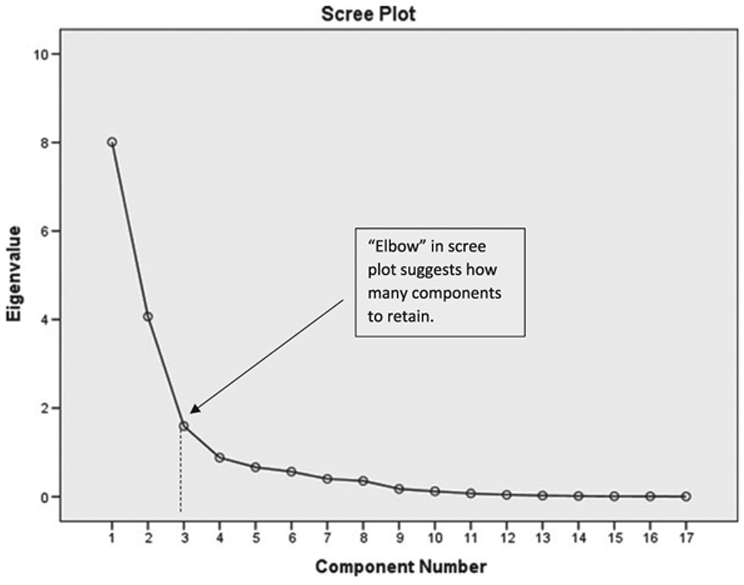
The scree plot relates each eigenvalue in order of magnitude to its component number. The figure is used to determine how many components to retain. Typically, this is right at the ‘elbow’ indicated by the dashed line.
Official websites use .gov
A
.gov website belongs to an official
government organization in the United States.
Secure .gov websites use HTTPS
A lock (
) or https:// means you've safely
connected to the .gov website. Share sensitive
information only on official, secure websites.
The scree plot relates each eigenvalue in order of magnitude to its component number. The figure is used to determine how many components to retain. Typically, this is right at the ‘elbow’ indicated by the dashed line.