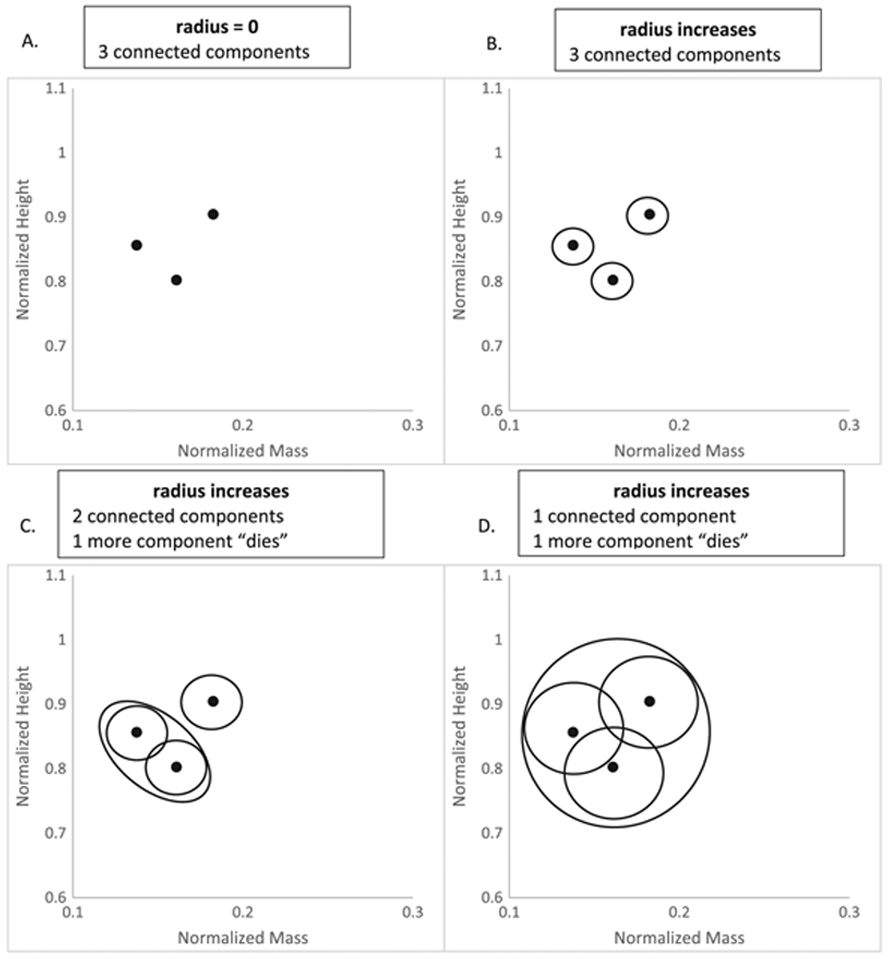
Figure 5.

(A–C) TDA ‘death’ process of components as the radius of the circles that cover data points increases. (A) consists of three data points, which by themselves represent three connected components. As the radius increases, they remain as three components (B), until eventually two circles overlap each other (C). The overlapping circles are combined as one, and therefore, one component that used to be alive now dies. (D) The radius has increased sufficiently to cover all three data points so that only one component remains. TDA, topological data analysis.
