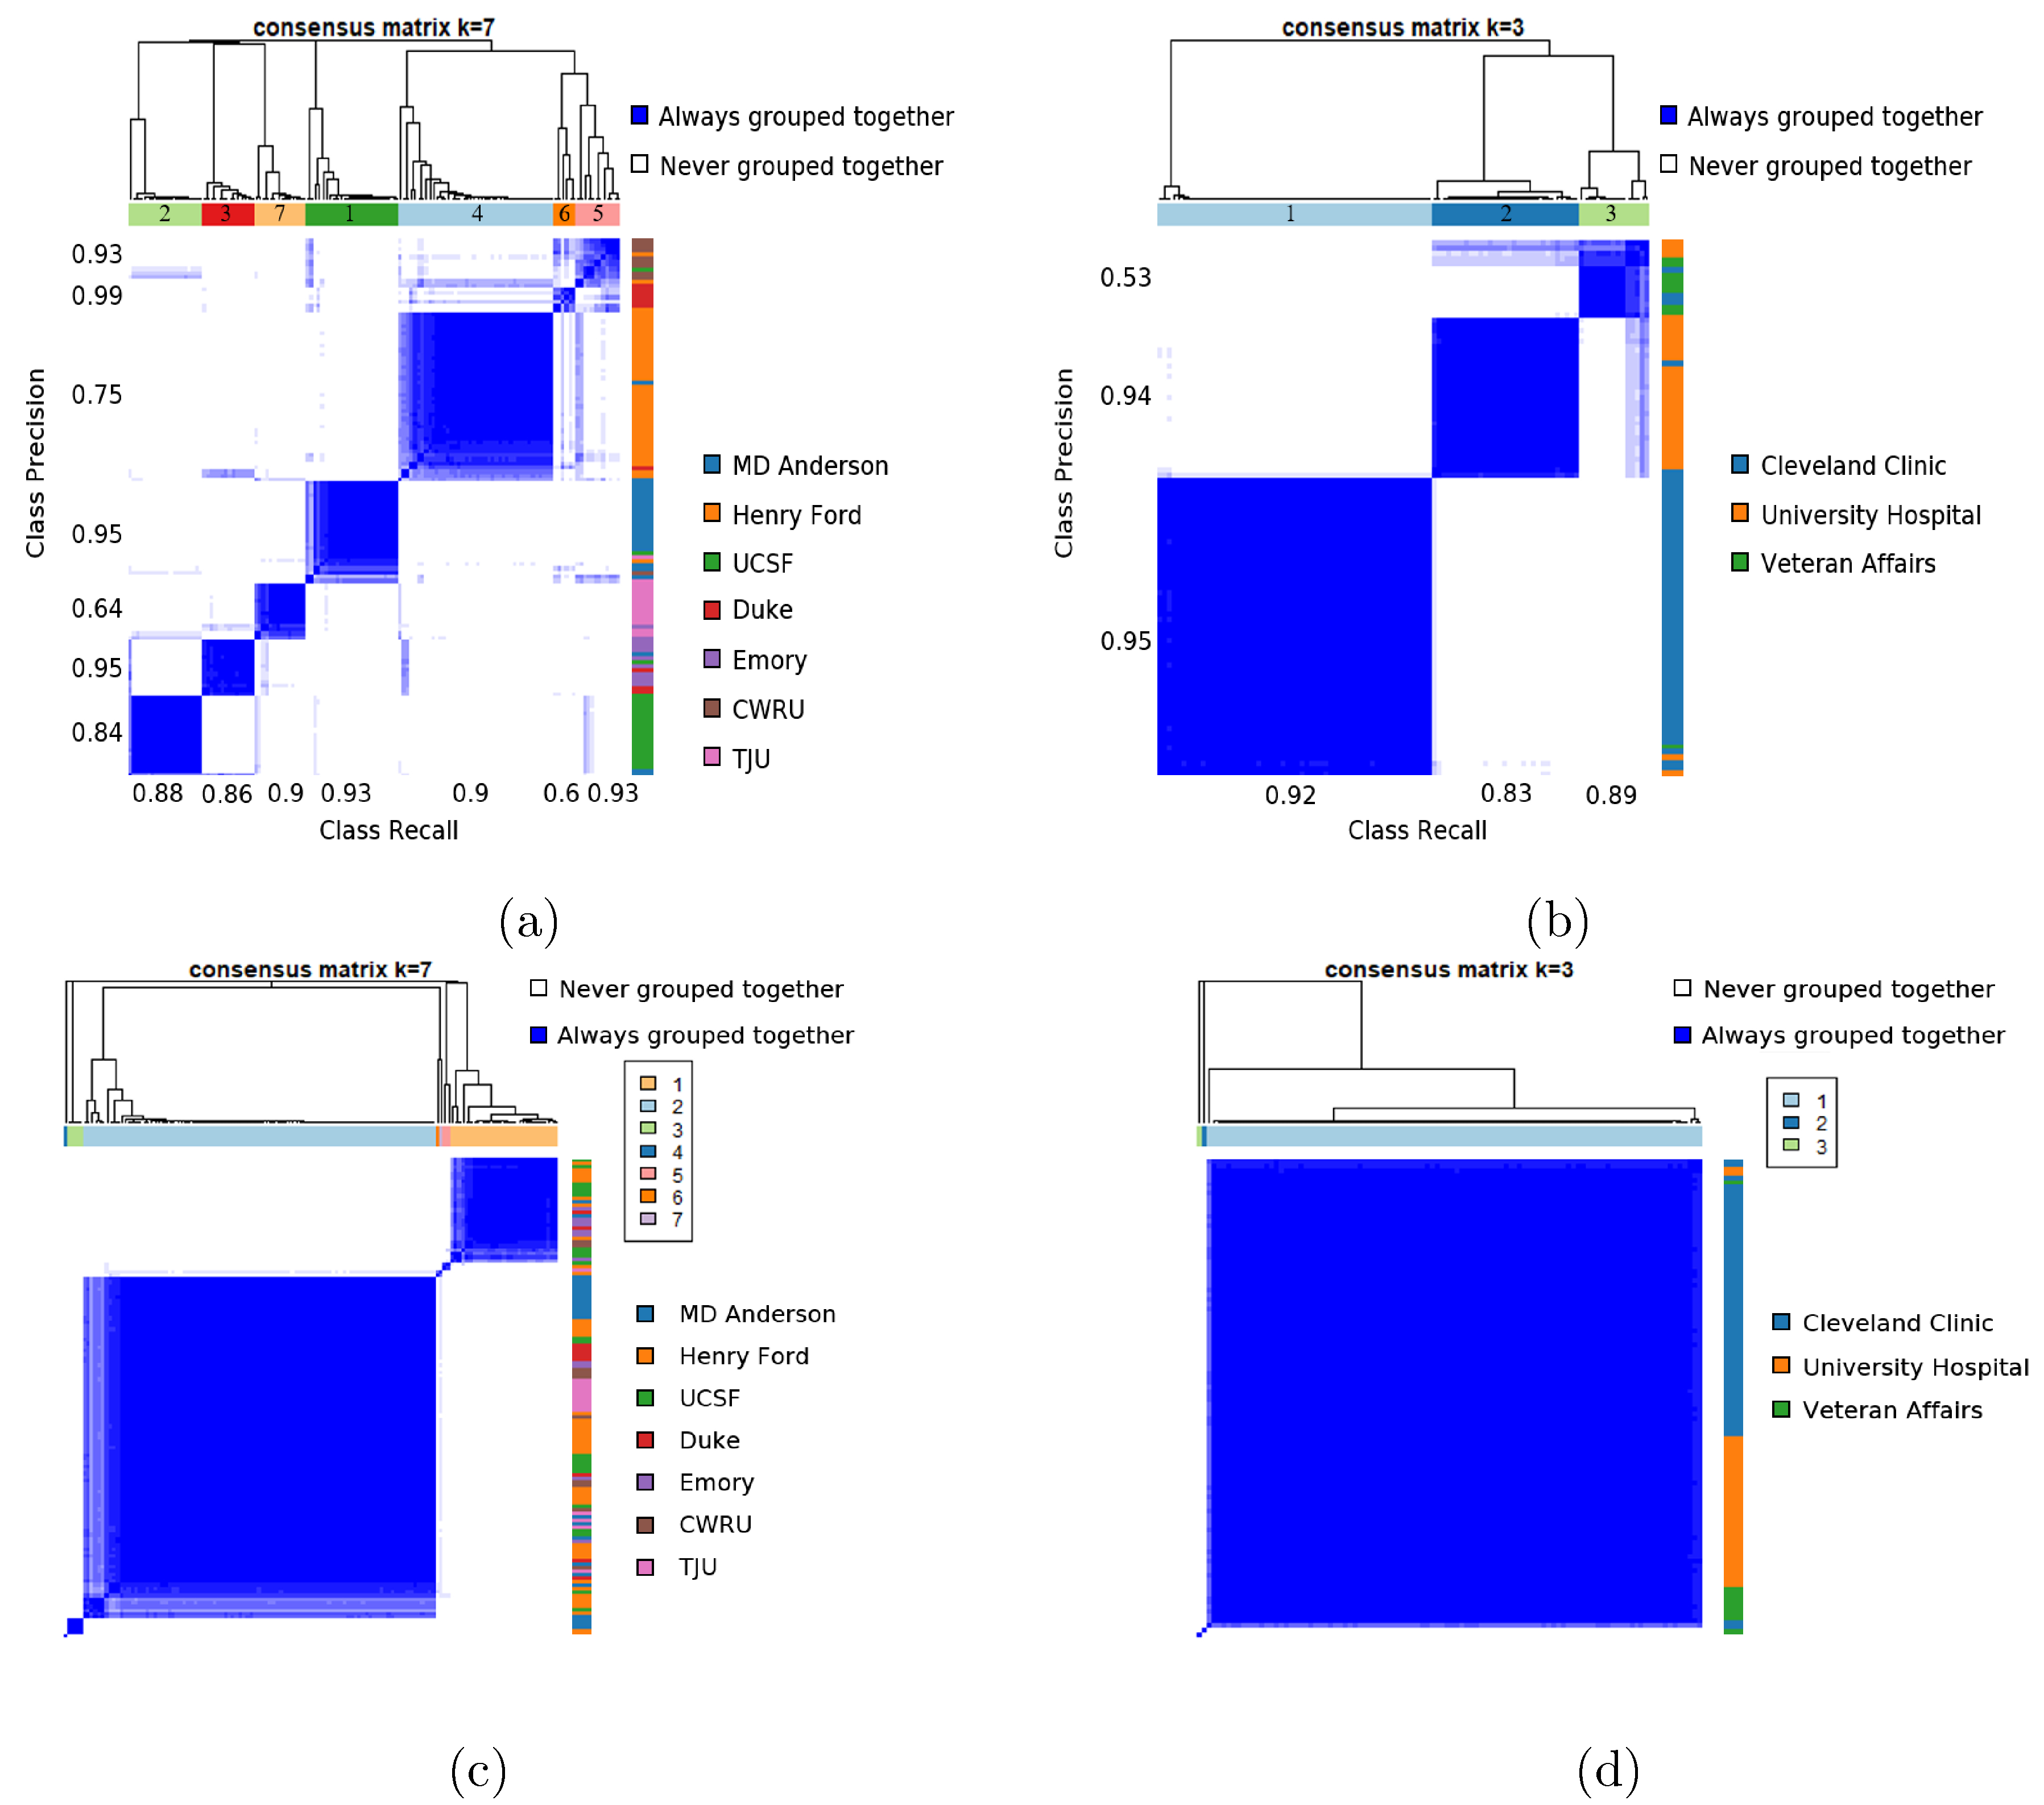
Figure 5:

Consensus clustegram of all 23 MRQy measures computed for (a) unprocessed TCGA-GBM cohort, (b) unprocessed rectal cohort, (c) processed TCGA-GBM cohort, and (d) processed rectal cohort. In each plot, the colorbar along the right corresponds indicates which site each dataset belongs to (legend alongside) while the colorbar at the top is the cluster label obtained via consensus clustering. For unprocessed data, precision and recall values for each cluster in identifying a specific site are also noted along the left and bottom of the clustergram, respectively.
