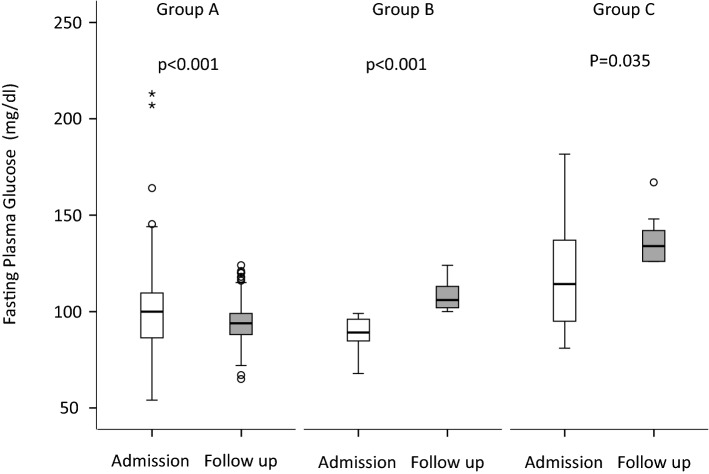
Fig. 3.
Fasting blood glucose according to the transitions between FBG categories during follow-up. Glucose measurements upon admission and at last follow in patients who maintained or improved their fasting blood glucose category during follow-up (Group A, n = 185; NFG to NFG, n = 92; IFG to IFG/NFG, n = 78; DFG to IFG/NFG, n = 15), who moved from NFG to IFG category (Group B, n = 66), who maintained or shifted to DFG during follow-up (Group C, n = 14; NFG to DFG, n = 4; IFG to DFG, n = 4; DFG to DFG, n = 6). Depicted are box and whisker plots. The line in the box is the median; the lower and upper border of the box are the 25th and 75th percentile of the data points, respectively. Whiskers extend to the lower and upper fence. Circles indicate outliers (calculated as 3rd quartile + 1.5 × interquartile range or 1st quartile—1.5 × interquartile range). Asterisks indicate extreme outliers (calculated as 3rd quartile + 3 × interquartile range or 1st quartile—3 × interquartile range). Statistical analysis: Wilcoxon signed-rank test

