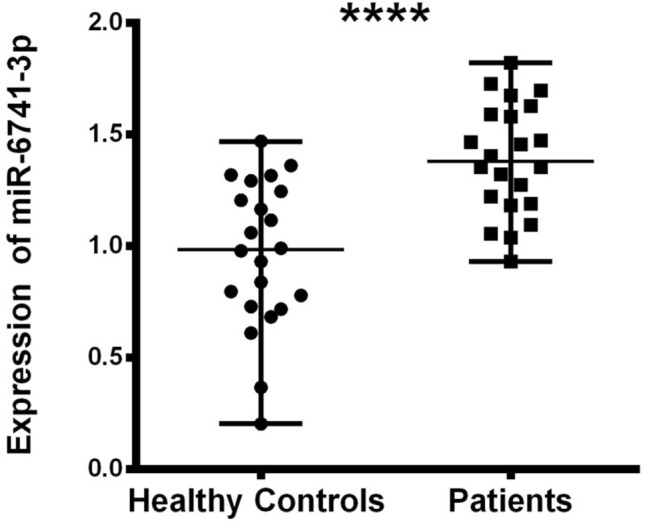
Fig. 3.

miR-6741-3p expression difference between healthy and patients subjects (nasopharyngeal swab samples) normalized by RNU6B_13 is shown by the dot plot (p < 0.05). Data were expressed as median with range. Data were non-parametric, they were analyzed by Mann–Whitney U test
