
Fig. 6 |. Expected results for CTCF blastocyst or single-cell uliCUT&RUN.
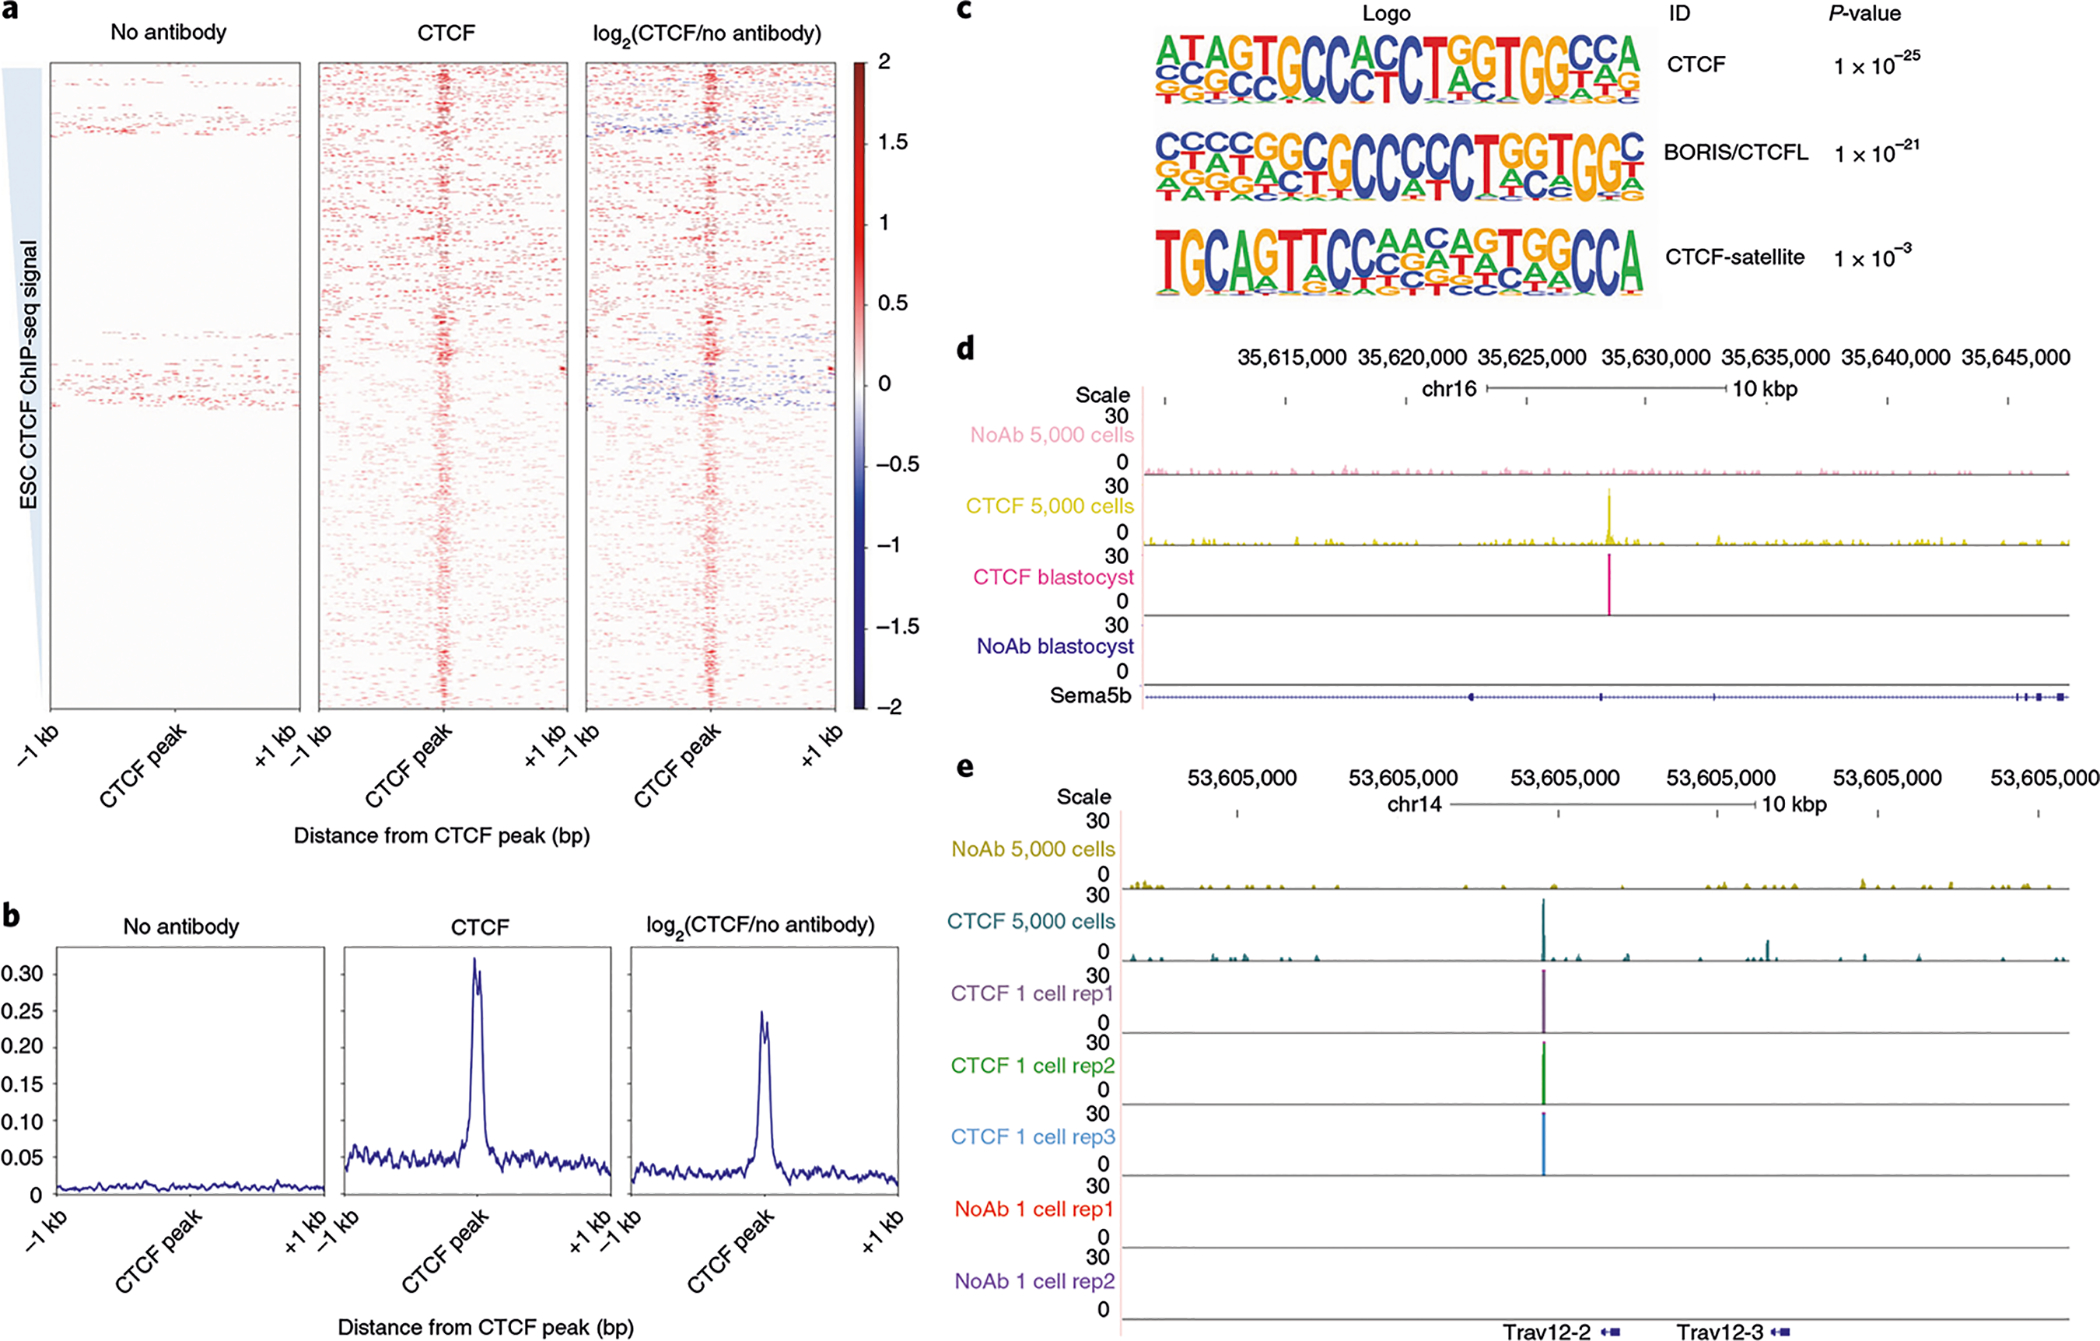
a, Heatmaps generated with deepTools for individual blastocysts subjected to uliCUT&RUN. Left panel contains signal for no-antibody control, the middle panel contains signal for CTCF and the right panel shows signal for the log2 enrichment of CTCF/no antibody. Data are shown over previously published CTCF ChIP-seq signal (GSE11431 (ref.84)), sorted from strongest CTCF peak to weakest CTCF peak within the ChIP-seq data. b, Metaplots generated with deepTools, over previously published CTCF ChIP-seq peaks. Panels as in a. c, Motif search performed with HOMER after peak calling from single blastocyst relative to no antibody demonstrating enrichment of CTCF motif within single blastocyst uliCUT&RUN data. d, Browser track of individual blastocyst CTCF and control uliCUT&RUN with CUT&RUN in high cell number (50,000) shown for comparison. e, Example browser tracks of single-cell CTCF and control uliCUT&RUN.