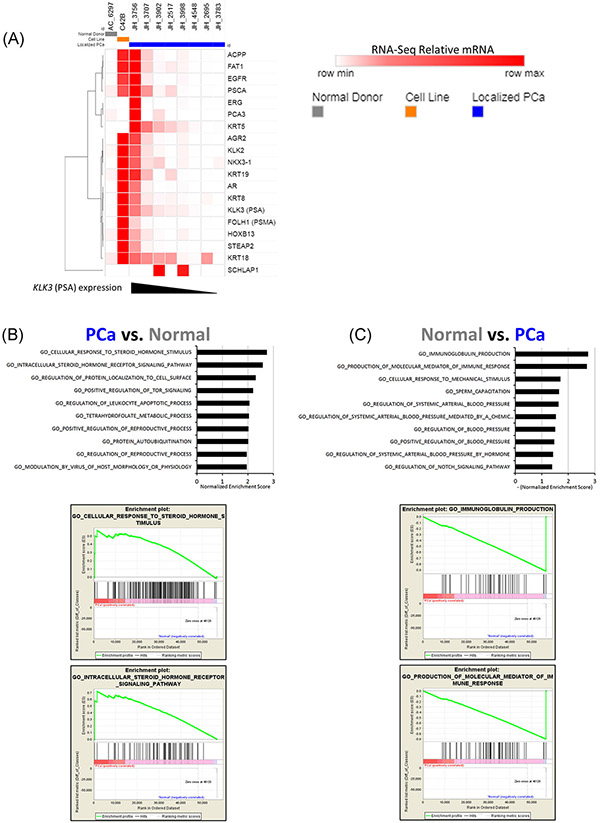
FIGURE 3.
Examination of BM putative DTC expression profiles by RNA sequencing. A, Heat map of relative TPM values of proposed PCa marker genes from samples of the FACS population containing putative DTCs. Samples are color coded as follows: gray, the one control patient with this population; orange, C42B cell line as a positive control; and blue, 8 Localized PCa patients. The localized PCa samples are ordered from left to right in decreasing order of KLK3 (PSA) expression. B, Gene Ontology analysis using GSEA software comparing the four highest KLK3 expressing localized PCa samples relative to the normal donor sample. Top: gene sets with the 10 highest normalized enrichment scores are listed. Bottom: Enrichment plots for the gene sets with the two highest normalized enrichment scores. C, Results from the gene ontology analysis shown in (B), for gene sets enriched in the normal donor relative to the localized PCa patient samples. BM, bone marrow; DTCs, disseminated tumor cells; FACS, fluorescence-activated cell sorting; GSEA, gene set enrichment analysis; PCa, prostate cancer; PSA, prostate-specific antigen; TPM, transcripts per million

