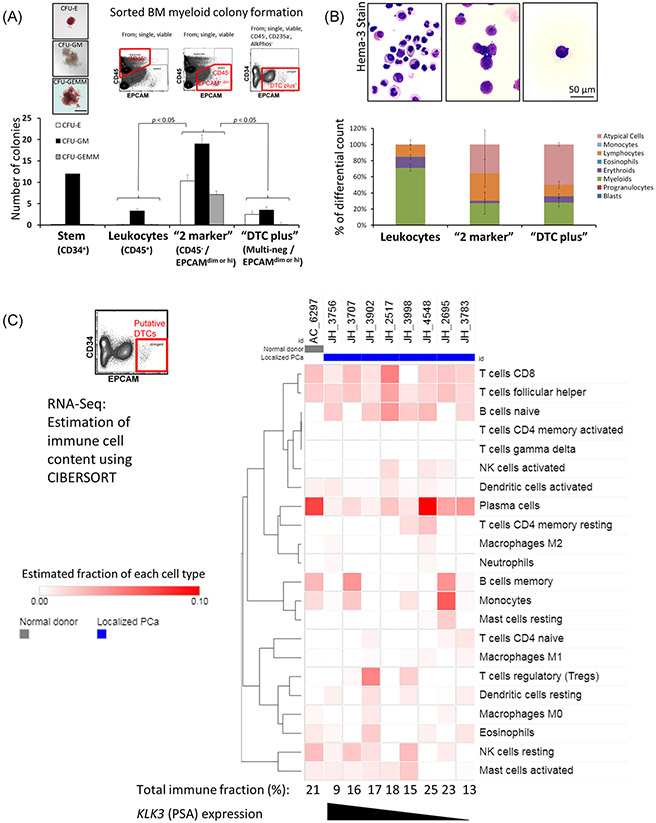
FIGURE 5.
Identity of contaminating cell types. A, Estimation of the number of contaminating myeloid precursors by colony formation. Upper left; example images of each colony type. Upper right: Example FACS plots describing the cell populations examined. Data are a representative experiment mean ± SD of the six rows of a 24-well plate. Means were compared by the Student t test. B, Estimation of contaminating cell types by morphology. Top: Hema3 (Wright-Giemsa) stained smears prepared after sorting the indicated cell populations; bottom: 500 cell marrow differential cell counts were performed by a blinded observer of smears from five patients. Data represent mean ± SEM. C, Estimation of immune cell content in the putative DTC population from the RNA-Seq data (as in Figure 3) using the CIBERSORT algorithm. FACS, fluorescence-activated cell sorting

