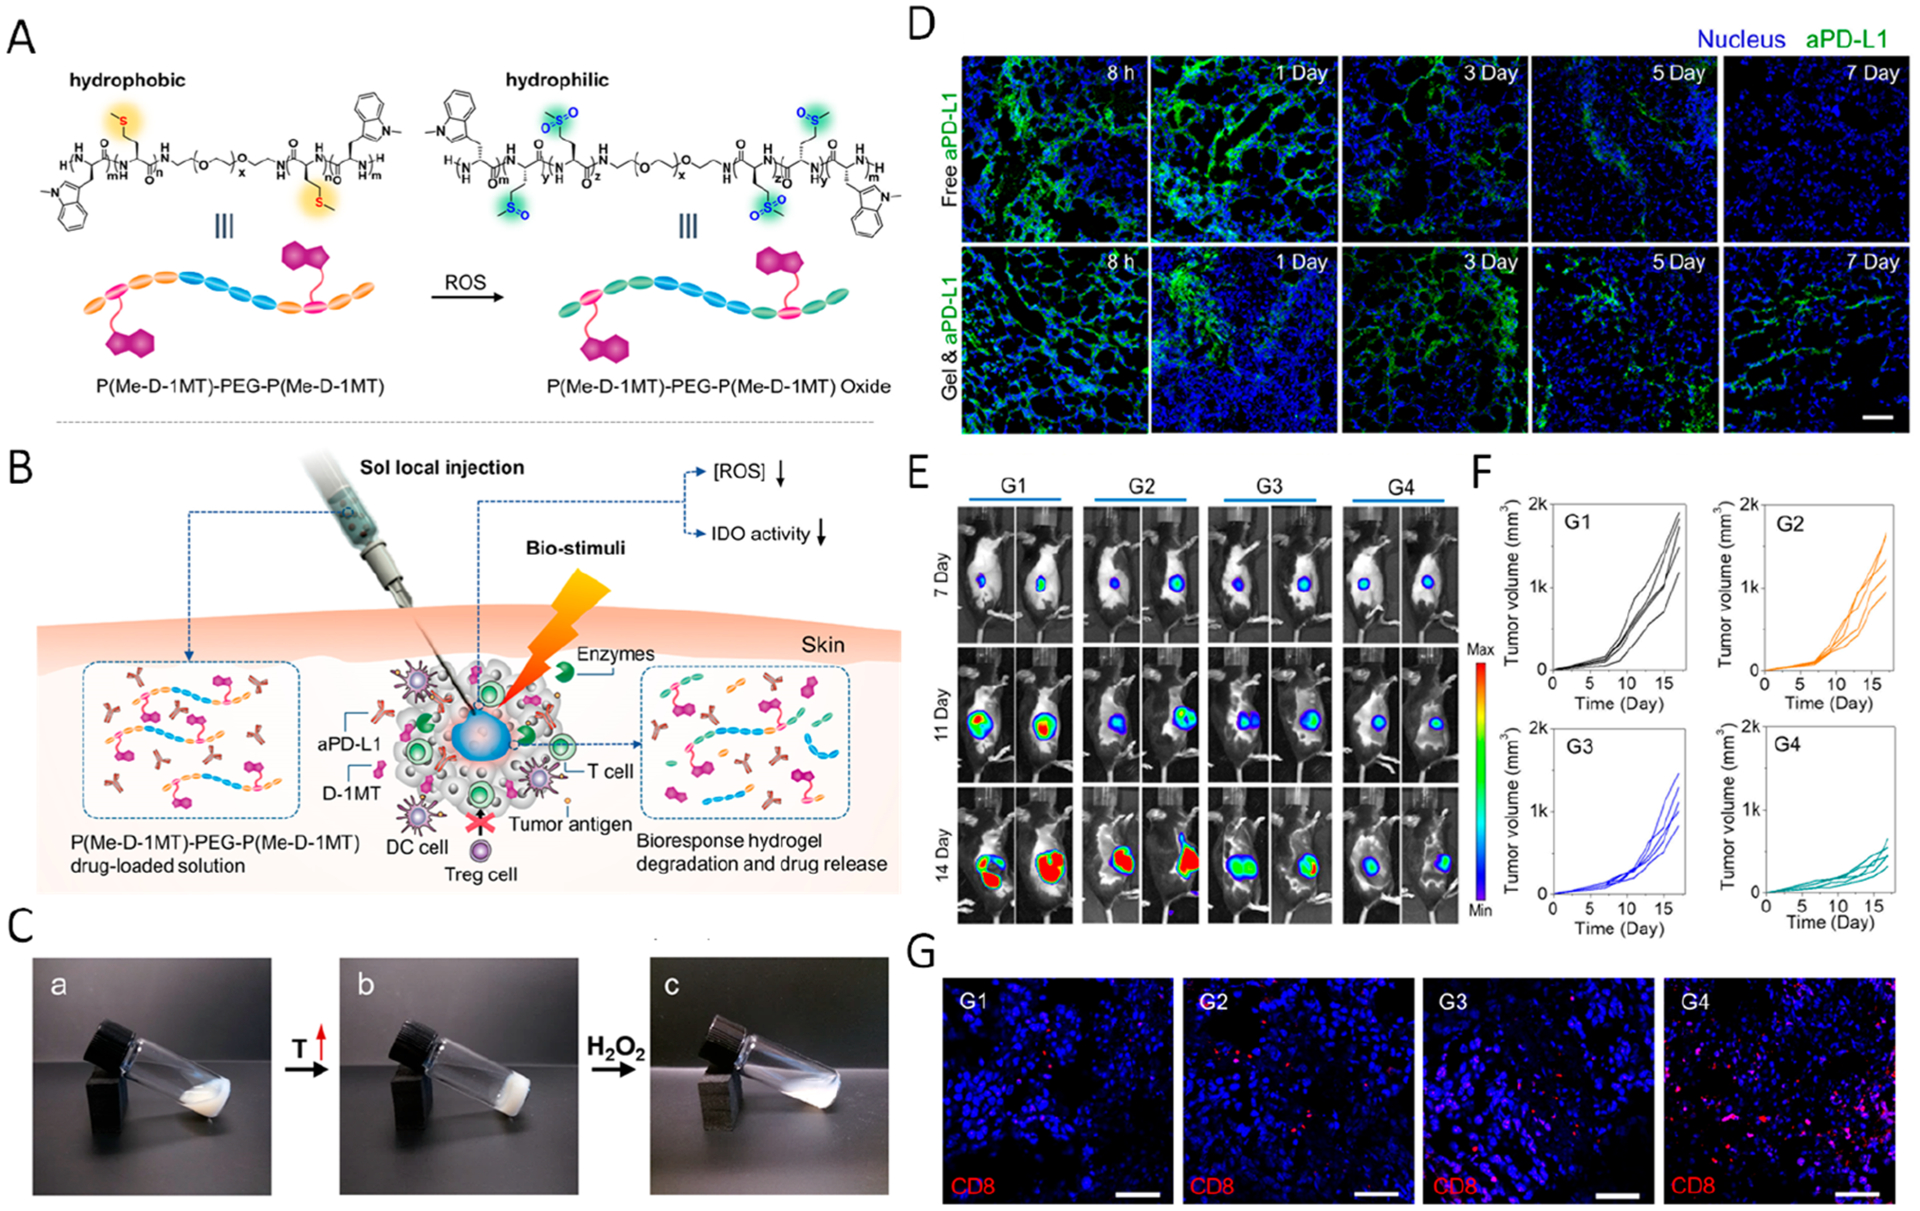
Figure 5.

(A) Polymeric hydrophobicity transformation of P(Me-D-1MT)–PEG–P(Me-D-1MT) triggered by ROS. (B) Schematic summary of in situ formed polypeptide hydrogels for controlled release of the cargo. (C) Phase change of the gel in response to increasing temperature and H2O2. (D) Fluorescent imaging showing the local retention of aPD-L1 under different formations. (E) Bioluminence imaging showing tumor growth in mice with different treatments (G1, PBS; G2, blank P(Me-D-1MT)–PEG–P(Me-D-1MT) hydrogel; G3, free aPD-L1 and D-1MT; G4, a-PD-L1 loaded P(Me-D-1MT)–PEG–P(Me-D-1MT) hydrogel) (F) Tumor growth curve in different groups. (G) Immunofluorescence imaging demonstrating CD8+ T cell infiltration. Reprinted and modified with permission from ref 36. Copyright 2018 John Wiley & Sons, Inc.
