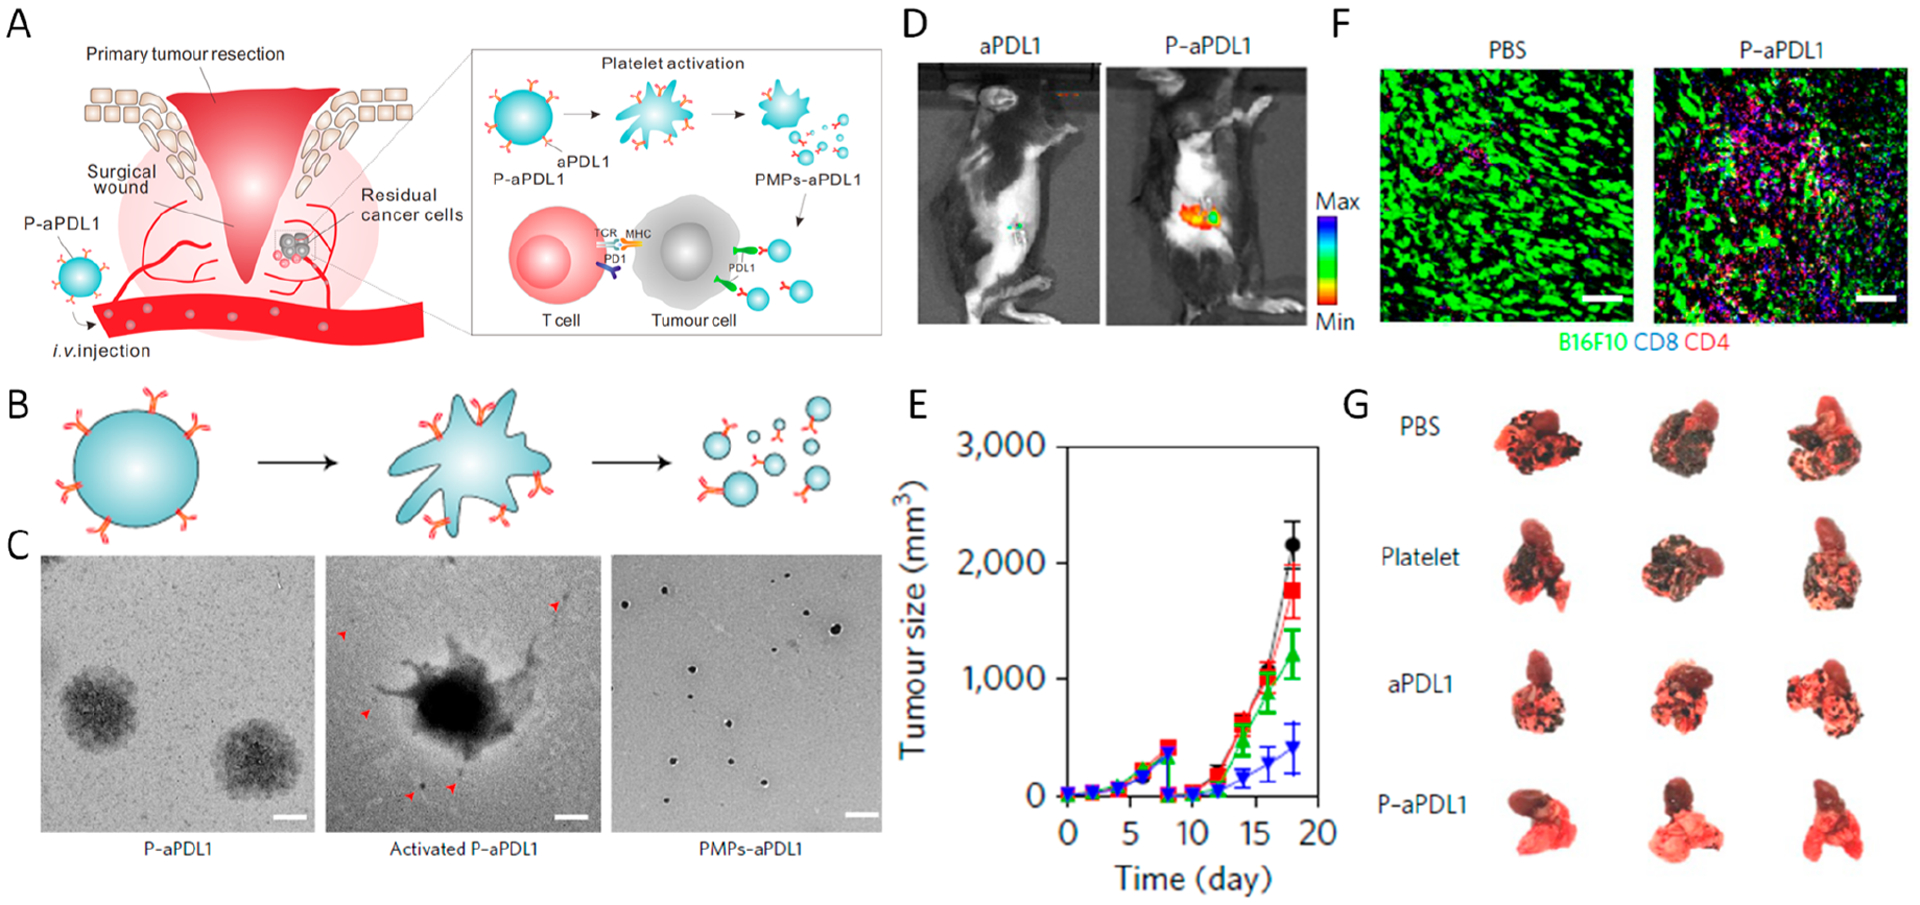
Figure 7.

(A) Schematic summary of targeted delivery of aPD-L1 to the tumor resection site using aPD-L1-conjugated platelets. TCR, T cell receptor; MHC, major histocompatibility complex. (B, C) TEM images of P-aPD-L1 before (left) and after (middle and right) activation. The red arrowheads indicate the PMPs released from the platelet (scale bar 0.5 μm). (D) Fluorescence images (aPD-L1–Cy5.5) of mice 2 h after intravenous injection of P-aPD-L1 or an equivalent dose of free aPD-L1. (E) Sizes of recurrent B16F10 tumors with different postsurgical treatments. Data are mean ± SEM. (F) Immunofluorescence staining of residual tumors showing infiltration of CD4+ and CD8+ T cells (scale bar 50 μm). (G) Representative lung photographs in different treatment groups in a melanoma metastasis model. Reprinted and modified with permission from ref 46. Copyright 2017 Springer Nature Limited.
