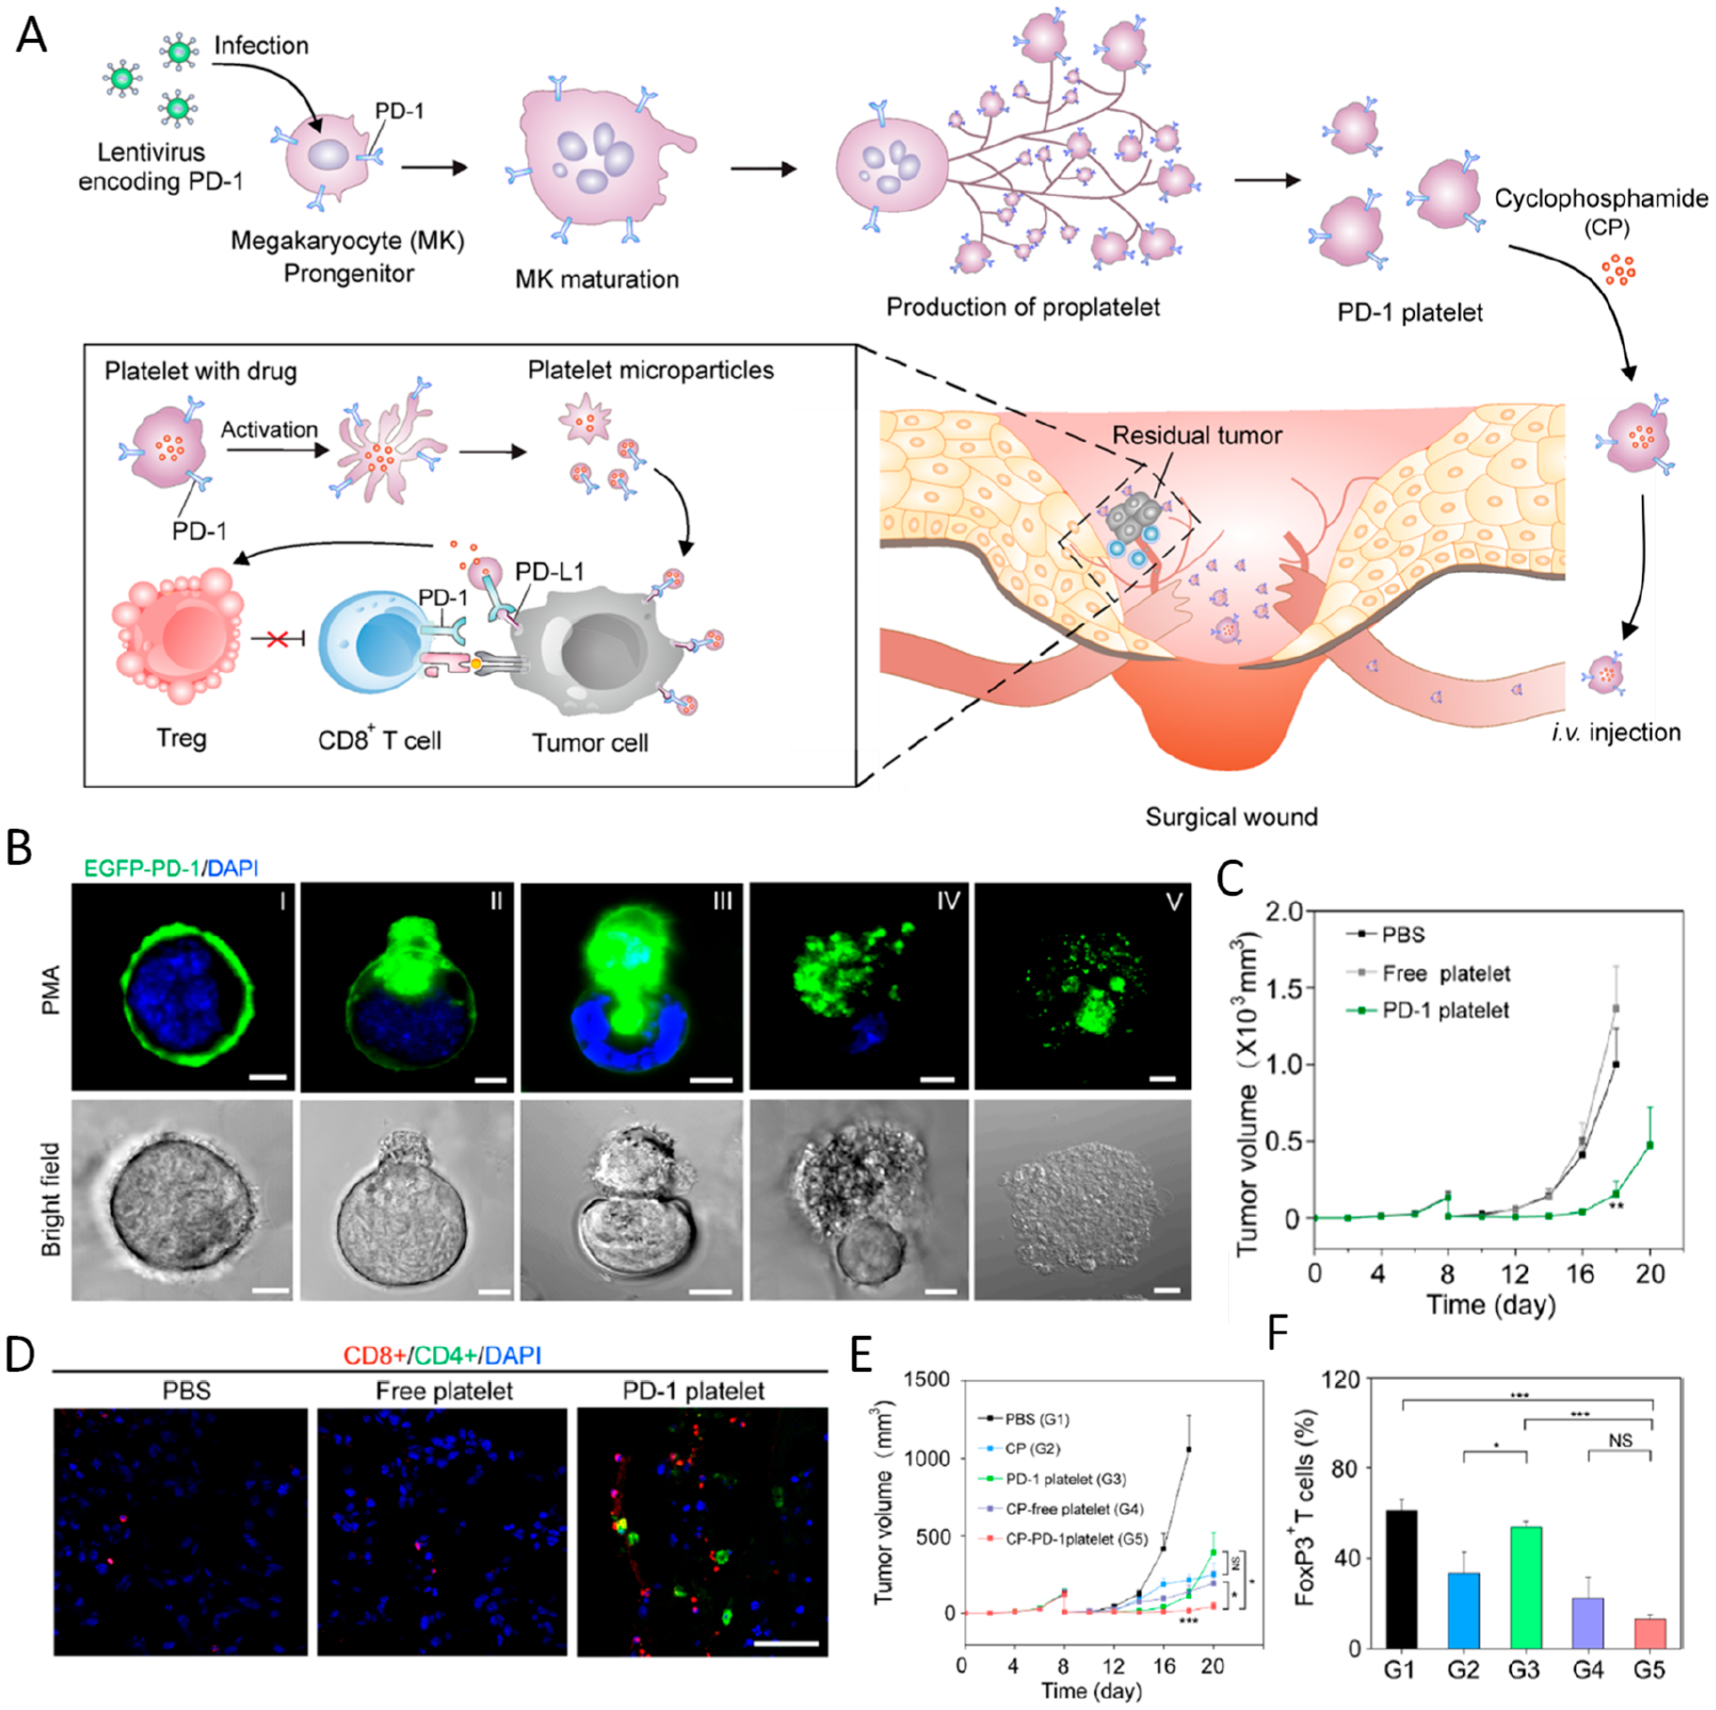
Figure 8.

(A) Schematic summary of the production of PD-1-expressing platelets. (B) Evolution process of PD-1-expressing proplatelets from MKs (scale bar 10 μm). (C) Average tumor volumes of mice with different treatments. Data are shown as the mean ± SEM. (D) Immunofluorescence of tumor sections verifying the infiltration of CD4+ and CD8+ T cells (scale bar 100 μm). (E) Average tumor volumes of mice with different treatment groups as indicated. Data are shown as the mean ± SEM. (F) Quantification of FoxP3 expression in CD4+ T cells within the tumors analyzed by flow cytometry (gated on CD4+ T cells). *P < 0.05; **P < 0.01; ***P < 0.005. Reprinted and modified with permission from ref 51. Copyright 2018 American Chemical Society.
