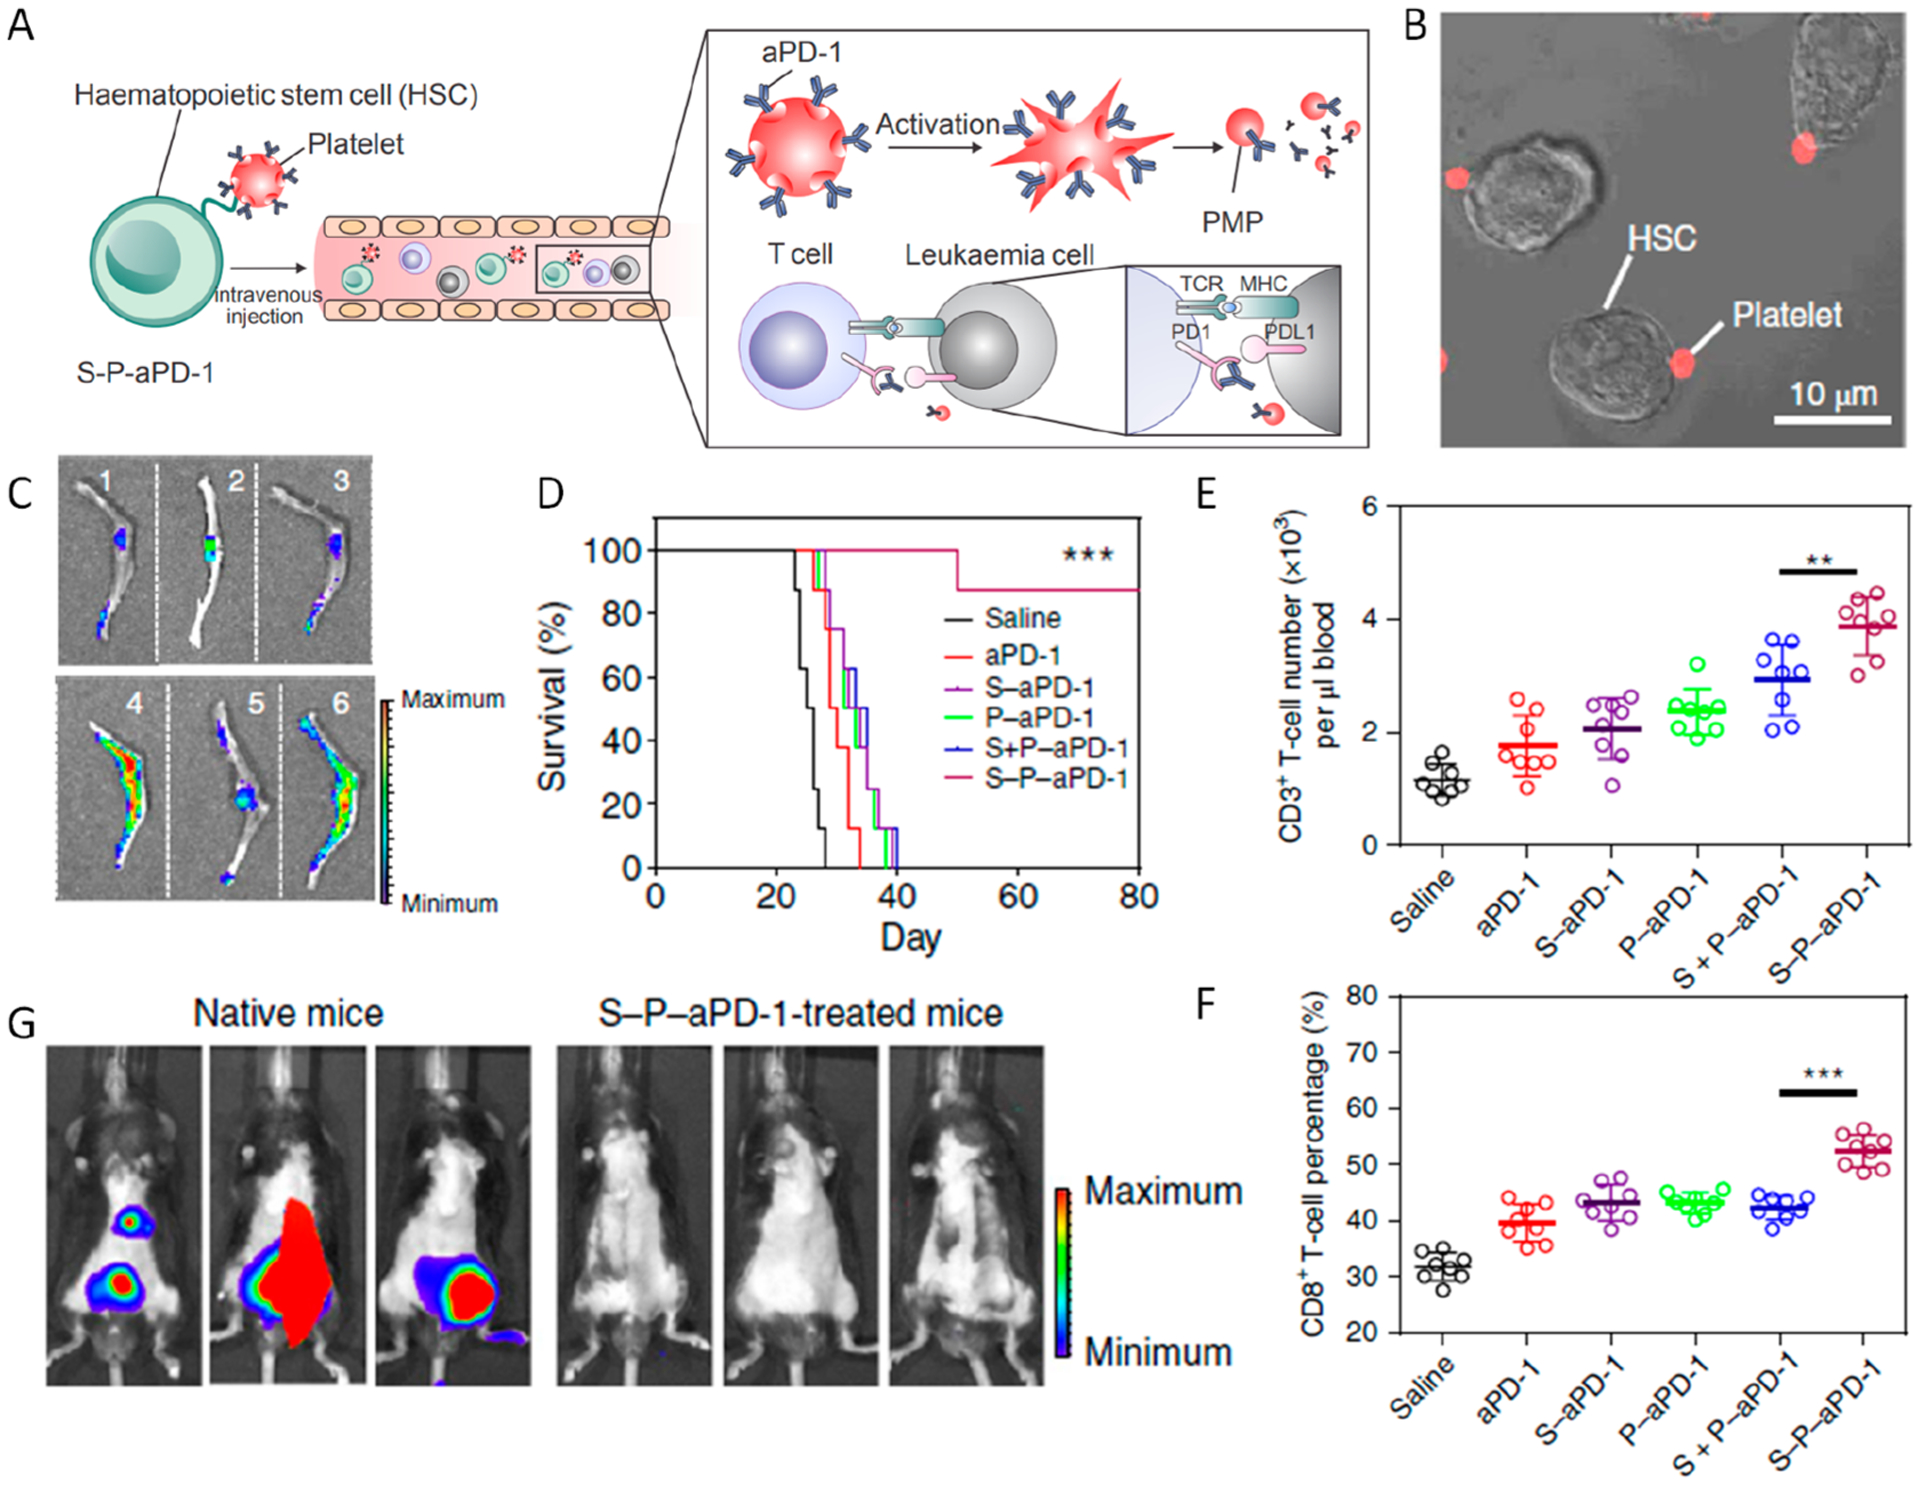
Figure 9.

(A) Schematic summary of HSC–platelet dual cell assembly assisted aPD1 delivery. (B) Confocal microscopy image of S-P-aPD1 conjugates. (C) Fluorescence images of bone tissues from mice treated with saline (1), Cy5.5-labeled free aPD1 (2), P-aPD1 (3), S-aPD1 (4), S + P-aPD1 (5), and S-P-aPD1 (6). (D) Survival curves for mice with different groups indicated. (E, F) Quantitative analysis of the percentage of CD3+ and CD8+ T cells. Data are presented as mean ± SD. **P < 0.01; ***P < 0.005. (G) Bioluminescence of mice rechallenged with C1498 cells after 3 weeks. Reprinted and modified with permission from ref 2. Copyright 2018 Springer Nature Limited.
