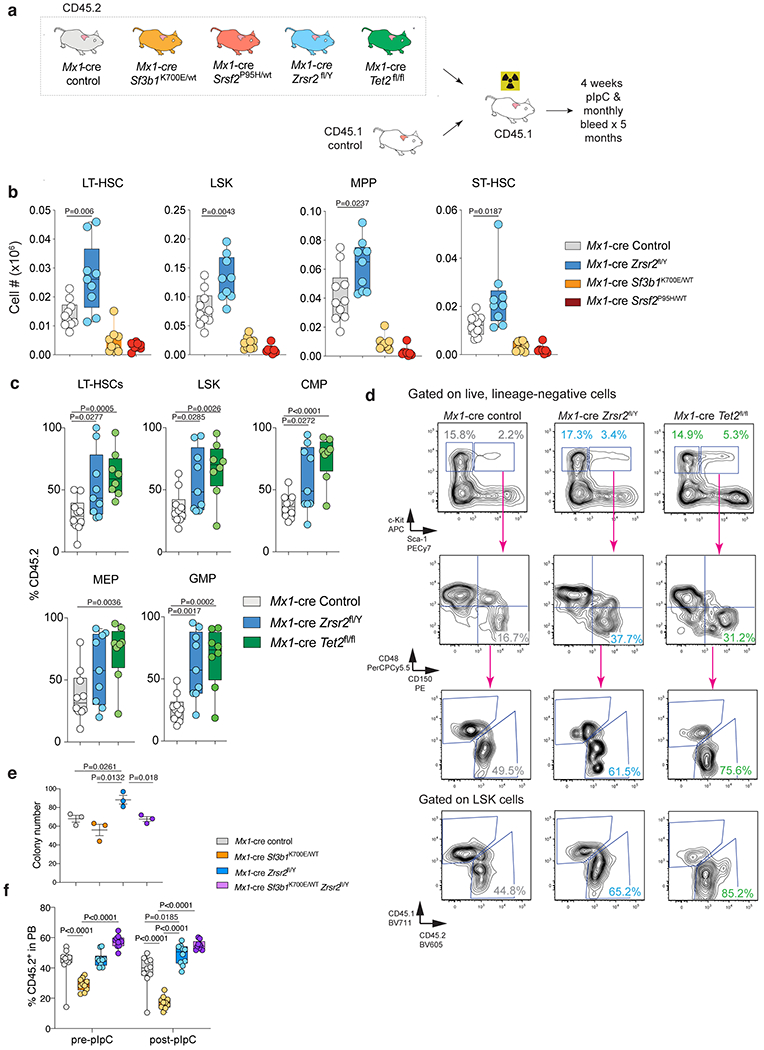
Extended Data Fig. 4. Comparison of the effects of Zrsr2 loss versus Tet2 knockout or Sf3b1K700E or Srsrf2P95H mutations on hematopoietic stem and progenitor cells.

(a) Schema of competitive bone marrow (BM) transplantation assays. (b) Absolute number of CD45.2+ long-term HSCs (LT-HSCs), LSK, and MPPs in the bone marrow of CD45.1 recipient mice 16 weeks following pIpC (n=8-10 each). For box and whiskers plots throughout, bar indicates median, box edges first and third quartile values, and whisker edges minimum and maximum values. (c) Percentage of CD45.2+ LT-HSCs, LSK, CMP, MEP, and GMP cells in the BM of CD45.1 recipient mice 16-weeks following pIpC (n=8-10 per each). P value was calculated relative to the control group by a two-sided t-test. (d) Representative FACS plots of data in (c). (e) Number of methylcellulose colonies generated from 100 sorted LT-HSCs from mice with the indicated genotype. n=3 biologically independent experiments. Error bars, mean values +/− SEM. P-values by one-way ANOVA with Tukey’s multiple comparisons test. (f) Percentage of CD45.2+ cells in the blood of recipient mice from Zrsr2 knockout/Sf3b1K700E/WT double mutant cells and relevant controls pre- and post-pIpC administration to recipient mice (n=10 each). P-values by two-way ANOVA with Tukey’s multiple comparisons test. Data in (b), (c), and (f) are shown as box-and-whisker plots where bar indicates median, box edges first and third quartile values, and whisker edges minimum and maximum values.
