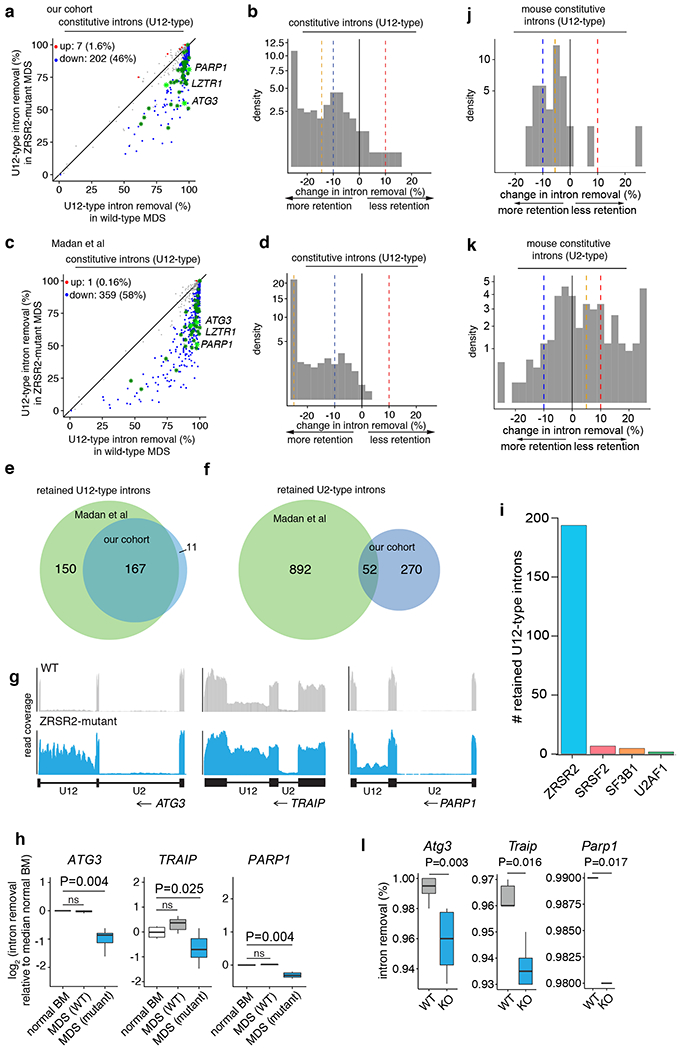
Figure 2. Widespread minor intron retention with ZRSR2 loss.

(a) Genome-wide quantification of differential splicing of U12-type introns from our patient cohort with key overlapping mis-spliced mRNAs in mouse hematopoietic precursors (green). Each point corresponds to a single intron and illustrates percentage of mRNAs in which the intron is spliced out. Blue/red dots: introns that exhibit significantly increased/decreased retention in ZRSR2-mutant versus WT cells, defined as an absolute change in retention of ≥10% or absolute log fold-change of ≥2 with associated p≤0.05. Green asterisks: minor introns differentially retained in both patient and mouse; light green asterisks: minor introns in genes of particular interest (Parp1, Lztr1, and Atg3). P-values, two-sided Mann-Whitney U test without adjustments for multiple comparisons. (b) Distribution of U12-type intron retention in ZRSR2-mutant samples (n=8 mutant and 10 wild-type). Blue/red dashed lines: thresholds of −10% and 10% for differential retention; gold line: median change in intron retention. (c) As (a), but for Madan at al cohort. (d) As (b), but for Madan et al cohort. (e) Overlap of U12-type intron retention events between the two patient cohorts (n=8 mutant and 4 wild-type). (f) As (e), but for U2-type introns. (g) RNA-seq coverage plots of U12-type, but not U2-type, intron retention in our patient cohort. Plots averaged over all samples with indicated genotypes. (h) Box plots quantifying splicing efficiencies of introns illustrated in (g) relative to normal marrow (median of 4 normal samples from Madan et al). P-values by two-sided Mann-Whitney U test. (i) Numbers of retained U12-type introns in samples bearing any of the four spliceosomal gene mutations from Beat AML cohort. Distribution of (j) U12-type or (k) U2-type intron retention in Zrsr2-knockout relative to wild-type mouse precursors. Blue/red dashed lines indicate thresholds of −10% and 10% used for differential retention; gold line: median change in intron retention. (l) Box plots illustrating intron splicing efficiencies in mouse lineage-negative c-Kit+ cells. For (h) and (l), the middle line, hinges, notches and whiskers indicate the median, 25th/75th percentiles, 95% confidence interval and most extreme data points within 1.5× interquartile range from hinge. P-values by two-sided Mann-Whitney U test.
