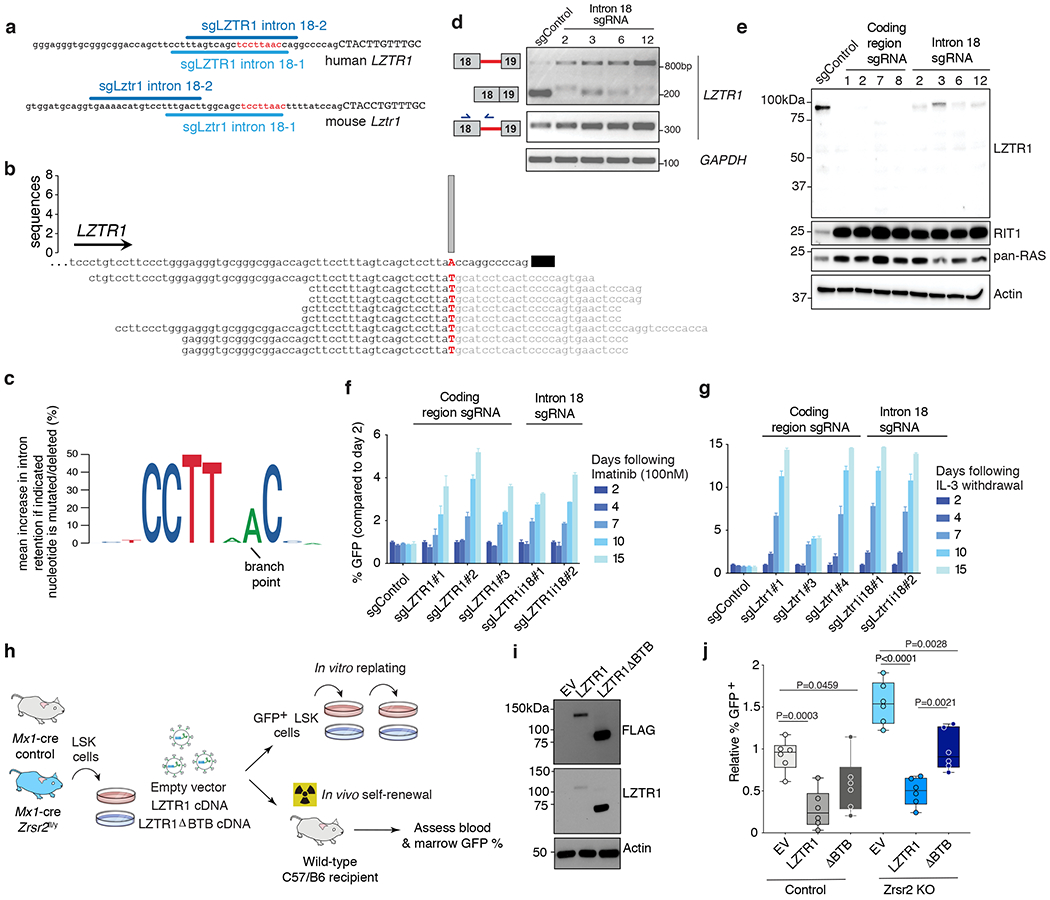
Figure 5. Impaired LZTR1 minor intron excision promotes clonal advantage and effects of LZTR1 re-expression on Zrsr2 null hematopoietic cells.

(a) Schematic of the minor intron branchpoint binding region in LZTR1 intron 18 with illustration of intronic sgRNA binding sequences (U12 conserved sequence in red). (b) Branchpoint within LZTR1’s minor intron based on intron lariat-derived RNA-seq reads. Bar represents number of supporting high-confidence reads, defined as those with a single identifying mismatch at the branchpoint characteristic of traversal of the 2’-5’ linkage. (c) Logo plot representation of minigene experiments summarizing mean increase in intron retention if indicated nucleotide is mutated (%). The height of each nucleotide indicates its requirement for normal excision of LZTR1’s minor intron. (d) RT-PCR for LZTR1 intron 18 excision in K562 AML single cell clones treated with intron 18-targeting sgRNAs. Experiment repeated three times with similar results. (e) Full-length WB of LZTR1 using N-terminal antibody as well as K-, N-, and H-RAS (“pan-RAS”) in K562 single cell clones treated with sgRNAs targeting protein-coding versus intronic sequence of LZTR1. Experiment repeated three times with similar results. (f-g) Relative percentage of (f) GFP-labeled K562 cells from (d) mixed with equal proportions of unlabeled cells to imatinib and (g) Ba/F3 cells treated with sgRNAs targeting the protein-coding region of LZTR1 following IL-3 withdrawal (median % relative to day 2 is plotted). (h) Schema of LZTR1 cDNA experiment. Lineage-negative cells from Mx1-cre Zrsr2 control and Zrsr2fl/y mice expressing empty vector, LZTR1 cDNA, or LZTR1 cDNA lacking BTB domains (“ΔBTB”). DAPI− GFP+ LSK+ cells were then sorted and tested for replating capacity or transplanted into mice. (i) Western blot of FLAG and LZTR1 in N-terminal FLAG-tagged empty vector (EV), LZTR1, and ΔBTB LZTR1. The experiment was repeated twice with similar results. (j) Relative % GFP+ blood cells from mice receiving lineage-negative cells from Mx1-cre Zrsr2 control or Zrsr2fl/y expressing constructs from (h). Mean value ± SEM shown. Bar indicates median, box edges first and third quartile values, and whisker edges minimum and maximum values. P-values calculated relative to the control group by a two-sided t-test and indicated in the figures.
