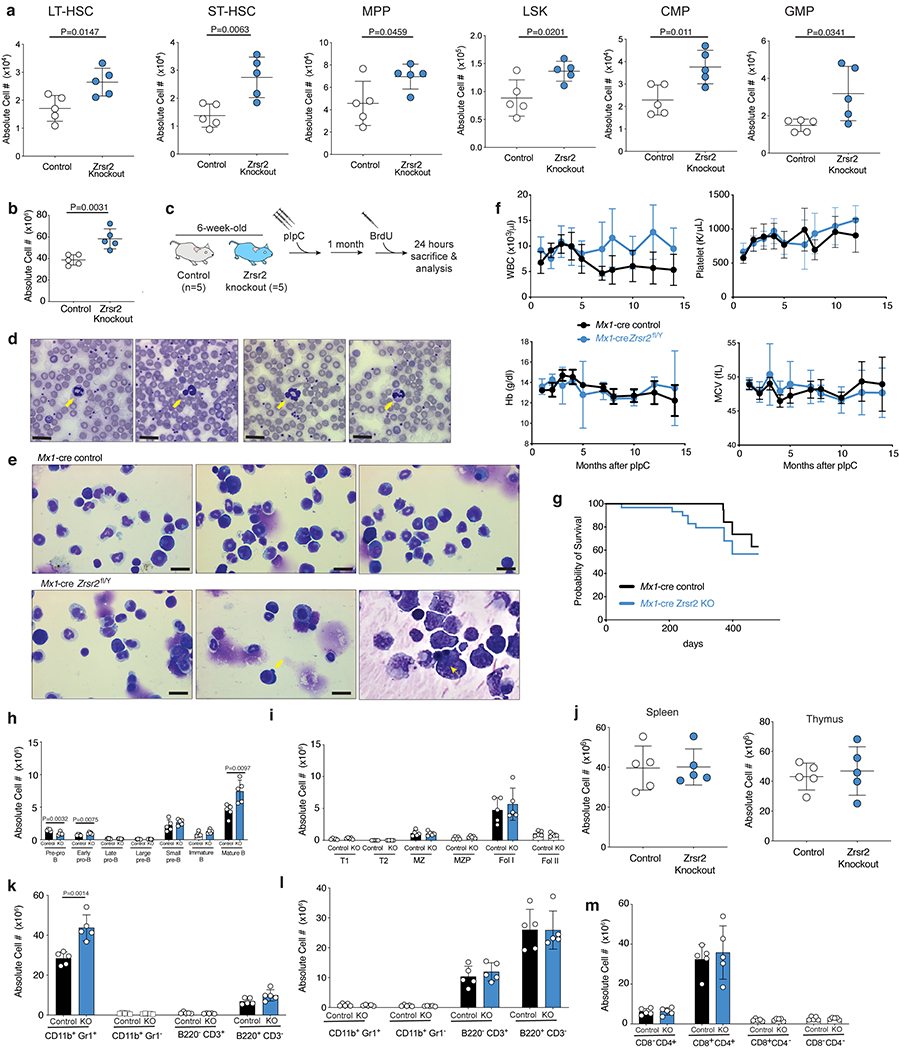
Extended Data Fig. 3. Characterization of Zrsr2 conditional knockout (cKO) mice.

(a) Absolute number of LT-HSCs, ST-HSCs, MPPs, LSKs, CMPs, and GMPs in primary, non-transplanted 20-week-old Mx1-cre control (“control”) and Mx1-cre Zrsr2fl/y mice. Mean ± SD. n=5 animals. (b) Absolute number of live, bone marrow (BM) mononuclear cells in 10-week old Mx1-cre control (“control”) and Mx1-cre Zrsr2fl/y mice (“Zrsr2 knockout”) 4-weeks following Zrsr2 excision. Mean ± SD. n=5 animals. P-values relative to control by two-sided t-test and indicated in figures. (c) Schematic of BrdU analysis of hematopoietic stem cells from mice in (b) and Fig. 1f. (d) Hyposegmented, hypogranular neutrophils in peripheral blood of 10-week old Mx1-cre Zrsr2fl/y mice (yellow arrows). Bar: 10mm. (e) BM cytospins indicating hyposegmented, hypogranular neutrophils (left panel) and dysplastic erythroid progenitors (middle and right panels, yellow arrows). Bar: 10mm. Experiment repeated three times with similar results in (d) and (e). (f) Peripheral blood white blood cell counts (WBC), platelet count, hemoglobin (Hb), and mean corpuscular volume (MCV) in primary Mx1-cre control (n=9) and Mx1-cre Zrsr2fl/y (n=10) mice (following Zrsr2 excision at 6 weeks age). Mean ± SD. (g) Kaplan-Meier survival of primary control and Zrsr2 KO mice (following Zrsr2 excision at 6 weeks age). Absolute numbers of (h) bone marrow and (i) spleen B-cell subsets. (j) Numbers of live, spleen (left) and thymic (right) mononuclear cells in mice from (h)-(i). Mean ± SD. Absolute numbers of live mature hematopoietic cells (k) in marrow and (l) spleen of 8-week-old Mx1-cre control (“control”) and Mx1-cre Zrsr2fl/y (“knockout” or “KO”) mice (Zrsr2 excision at 4 weeks). (m) Absolute numbers of T-cell subsets in thymus of mice from (k). Mean ± SD shown throughout. Mx1-cre control (n=5) and Mx1-cre Zrsr2fl/y (n=5) mice were used in (h) to (m). P-values relative to control by two-sided t-test and indicated in figures.
