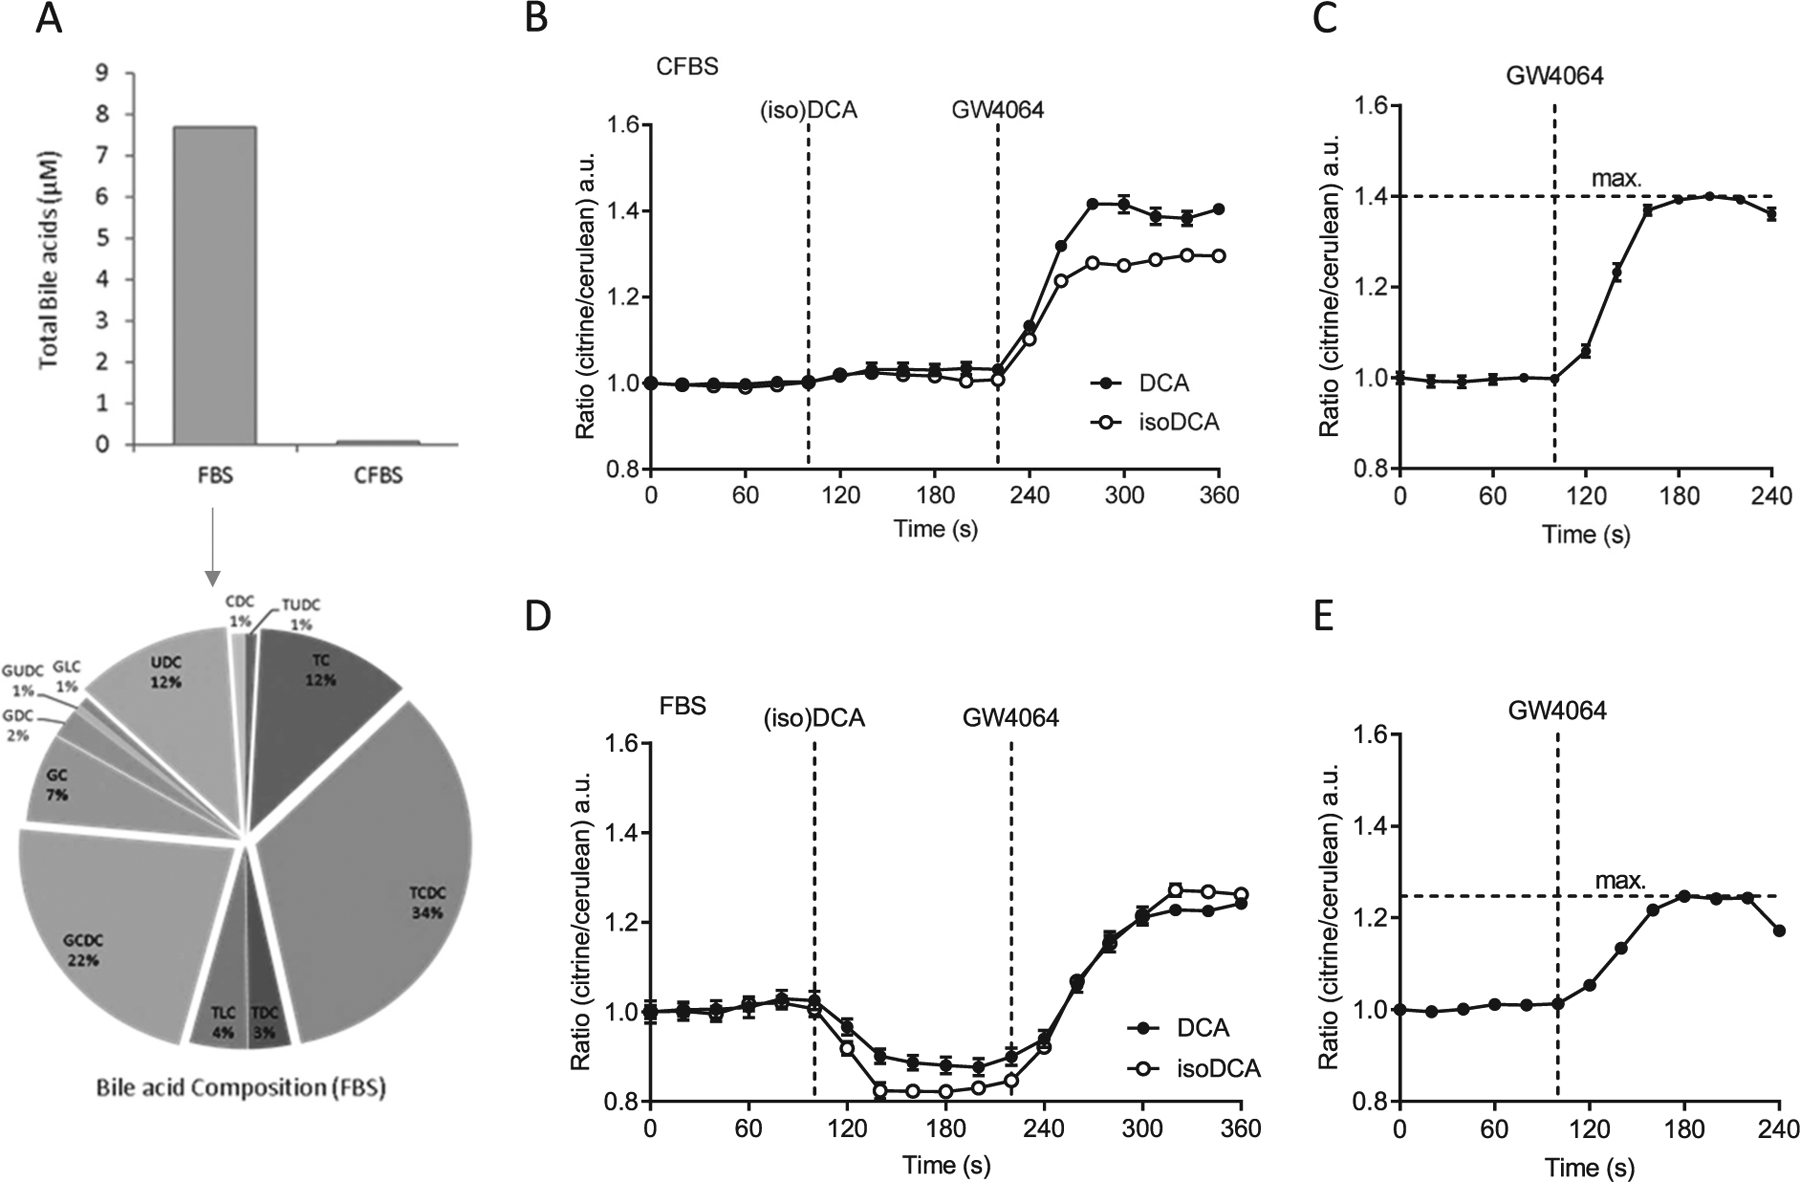
Fig. 4.

FRET emission ratios in NucleoBAS expressing cells cultured in DMEM containing complete FBS (+FBS) or charcoal stripped FBS (+CFBS). (A) Quantification of total BAs from FBS and CFBS and composition of individual BAs shown as percentage; UDC = Ursodeoxycholic, C = Cholic, CDC = Chenodeoxycholic, DC = deoxycholic, LC = Lithocholic; G (glycine) and T (taurine) conjugated bile acids. (B-E) Changes in FRET emission ratio in NucleoBAS cells expressing NTCP-mKate2 cultured (B) in DMEM containing CFBS upon addition of 100 μM isoDCA or DCA at t = 100 s and 5 μM GW4064 at t = 220 s. (C) Changes in FRET emission ratio of cells cultured in DMEM containing CFBS upon addition of 5 μM GW4064 alone at t = 100. (D) Changes in FRET emission ratio of cells cultured in DMEM containing FBS upon addition of 100 μM isoDCA or DCA at t = 100 s and 5 μM GW4064 at t = 220 s. (E) Changes in FRET emission ratio of cells cultured in DMEM containing FBS upon addition of 5 μM GW4064 alone at t = 100. (n = 6 cells per experiment). Error bars represent the SEM.
