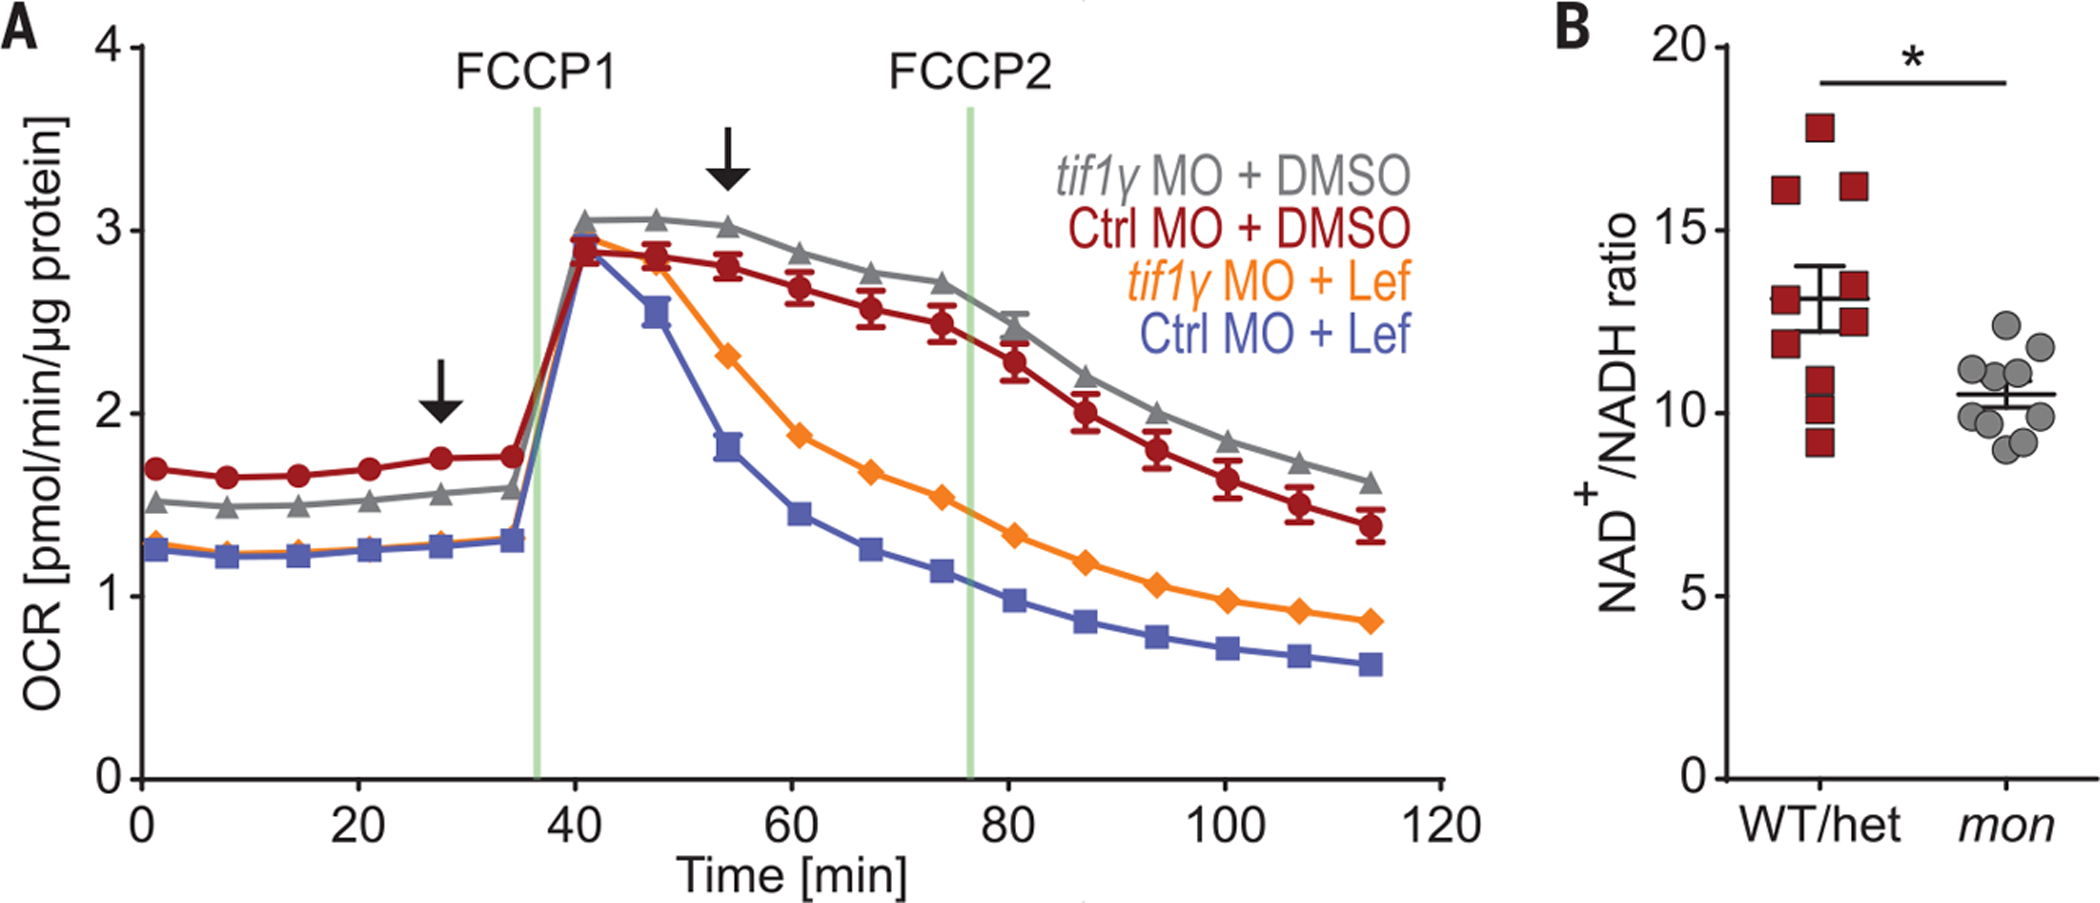
Fig. 3. tif1γ loss leads to a functional mitochondrial defect.

(A) OCR as measured by Seahorse analysis of single tif1γ KD or Ctrl KD embryos at 16 hpf treated with 7 μM leflunomide or DMSO from 5.3 until 11 hpf. N = 3. Data from one representative experiment are shown. Data are shown as means ± SEM. Arrows indicate time points for which statistical analysis is shown in fig. S14, A and B. (B) Analysis of NAD+/NADH ratio in mon and sibling WT or het embryos at 48 hpf using the NAD/NADH-Glo Assay. N = 3. Cumulative results are shown. One data point indicates one embryo. *P < 0.05, two-tailed t test.
