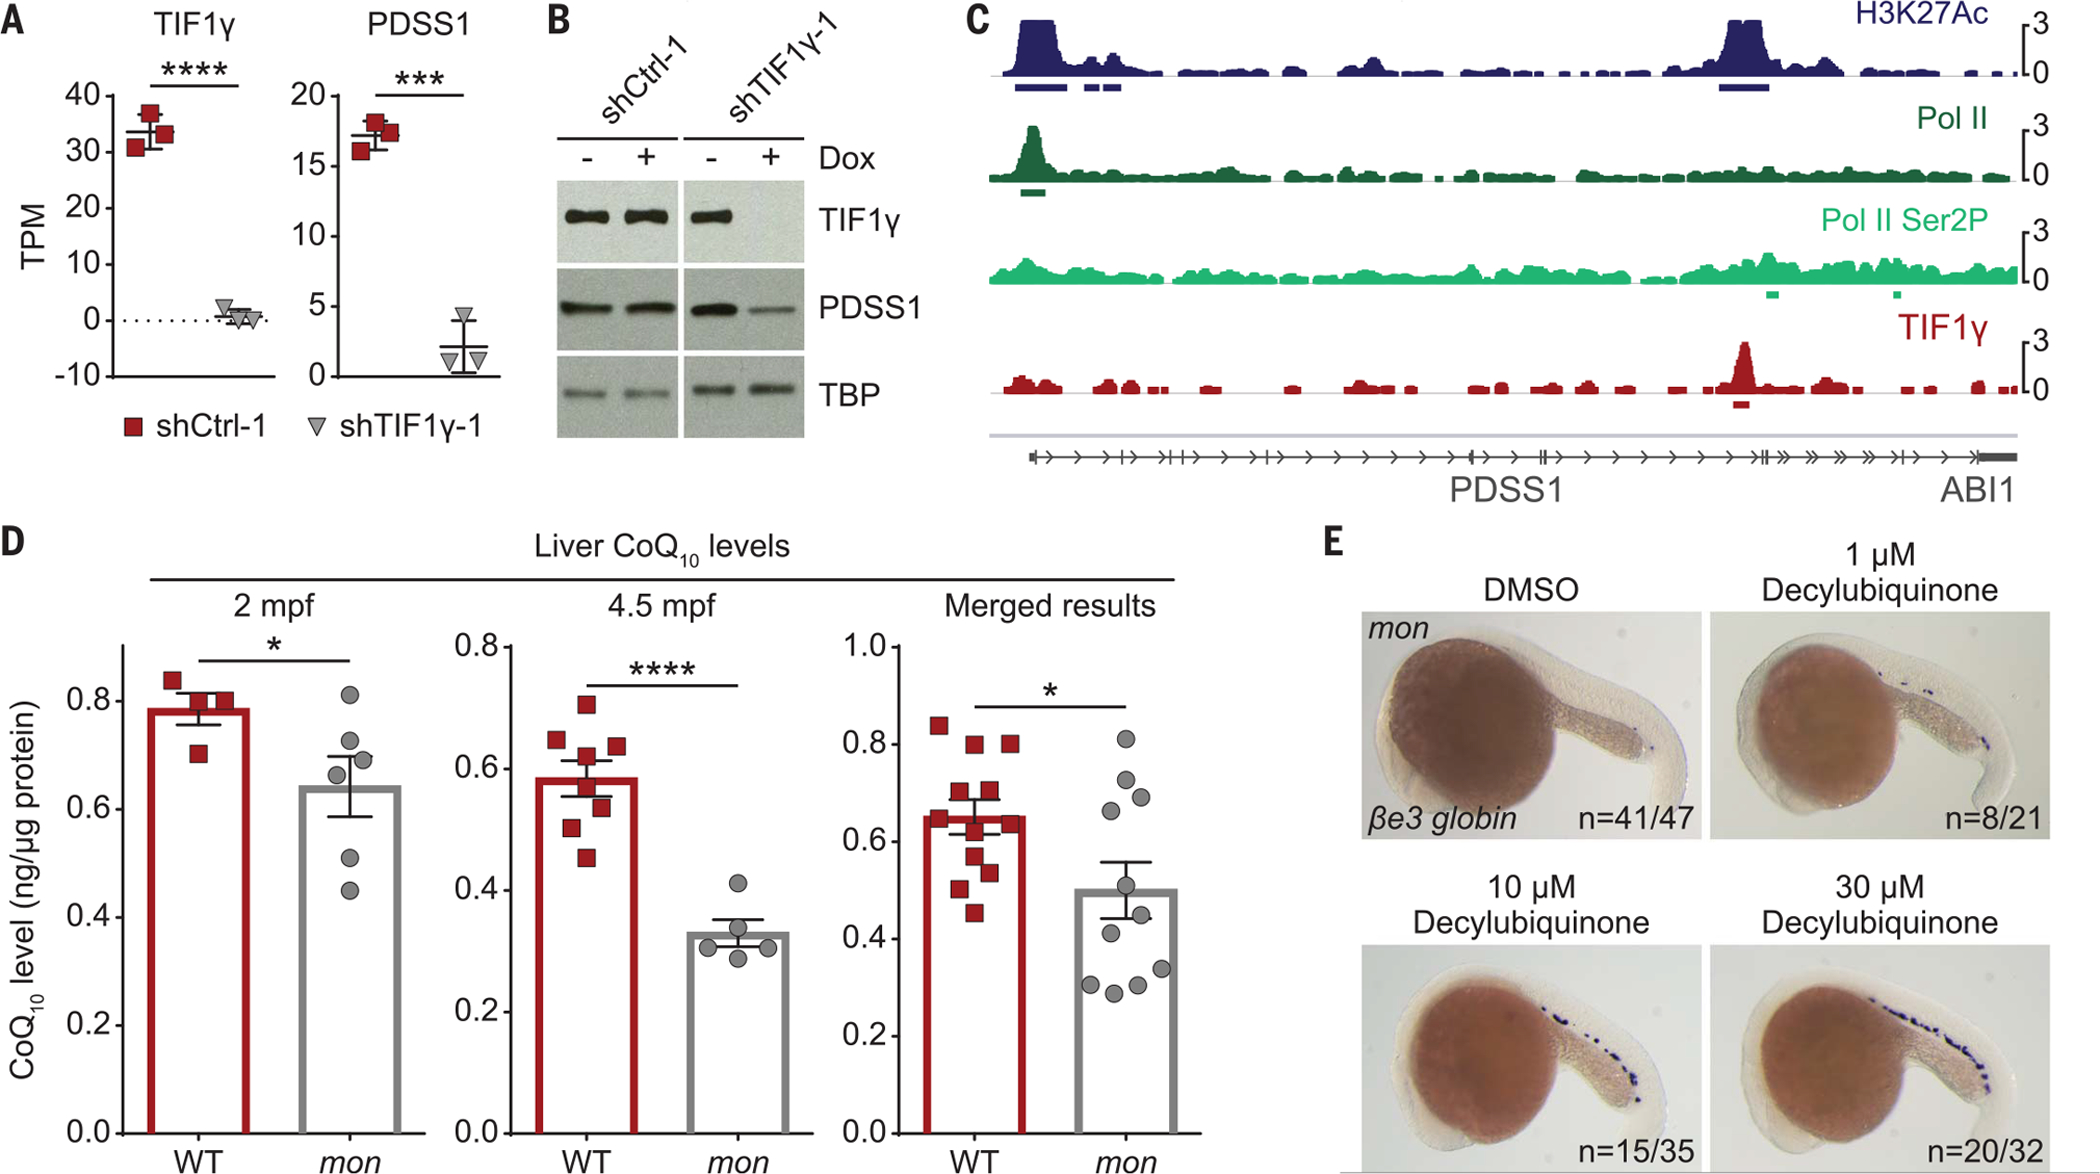
Fig. 5. CoQ is a functional target of tif1γ in primitive erythropoiesis.

(A) RNA-seq data showing transcripts per kilobase million (TPM) of TIF1γ and PDSS1 in two stable HepG2 clones carrying either an inducible shRNA targeting TIF1γ (shTIF1γ-1) or a control shRNA (shCtrl-1) 48 hours after induction with doxycycline. N = 3. Results were analyzed with two-tailed t test. (B) Western blot of TIF1γ and PDSS1 for the experiment described in (A). TBP was used as the loading control. (C) IGV output of a 52-kb genomic region around PDSS1 on chromosome 10 showing the chromatin occupancy by ChIP-seq for H3K27Ac, Pol II, Pol II phosphorylated at serine 2 (Pol II Ser2P), and TIF1γ in HepG2 cells. (D) CoQ10 quantification of adult mon and WT livers at indicated time points by HPLC. mpf, months postfertilization. Merged results are shown on the right. Each dot represents five pooled livers (except for one sample per genotype at 4.5 mpf, which only contained three livers). Normalization to total protein amount per sample. (E) Representative βe3 globin WISH images of embryos at 22 hpf treated with DMSO or 1, 10, 20, or 30 μM decylubiquinone. N = 3. Cumulative results are shown. ****P < 0.0001; ***P < 0.001; *P < 0.05 (see also figs. S18 to S21).
