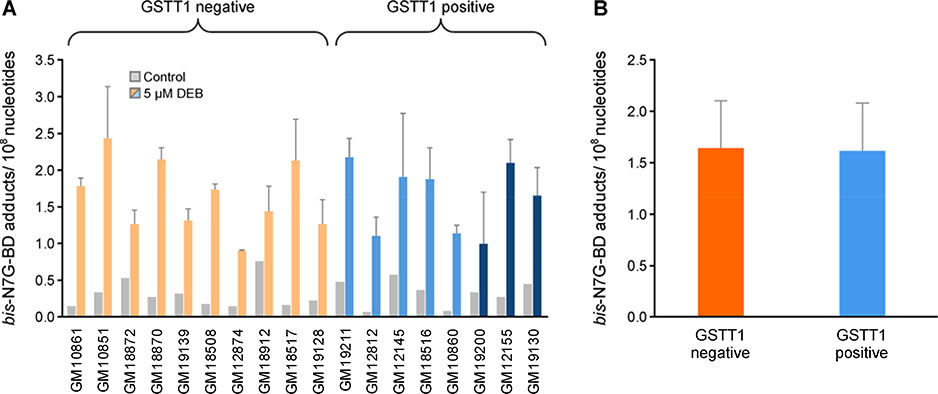
Figure 7.
A. Levels of bis-N7G-BD adducts in GSTT1 negative and GSTT1 positive cell lines. B. Comparison of bis-N7G-BD adduct levels in GSTT1 negative and positive cell lines treated with DEB (mean ± SD). Eighteen lymphoblastoid cell lines (3 million cells) were treated with 0 or 5 μM DEB for 6 h in triplicate. DNA was extracted and bis-N7G-BD adduct levels were quantified by nanoLC-MS/MS. Cell lines are color coded based on GSTT1 genotype, null (orange), heterozygote (light blue) and homozygote (dark blue), and organized based on DEB-induced apoptosis after 10 μM treatment (Figure 2). Gray bars indicate contro cell lines and light and dark shades of orange or blue indicate 5 or 10 μM DEB treatment, respectively.

