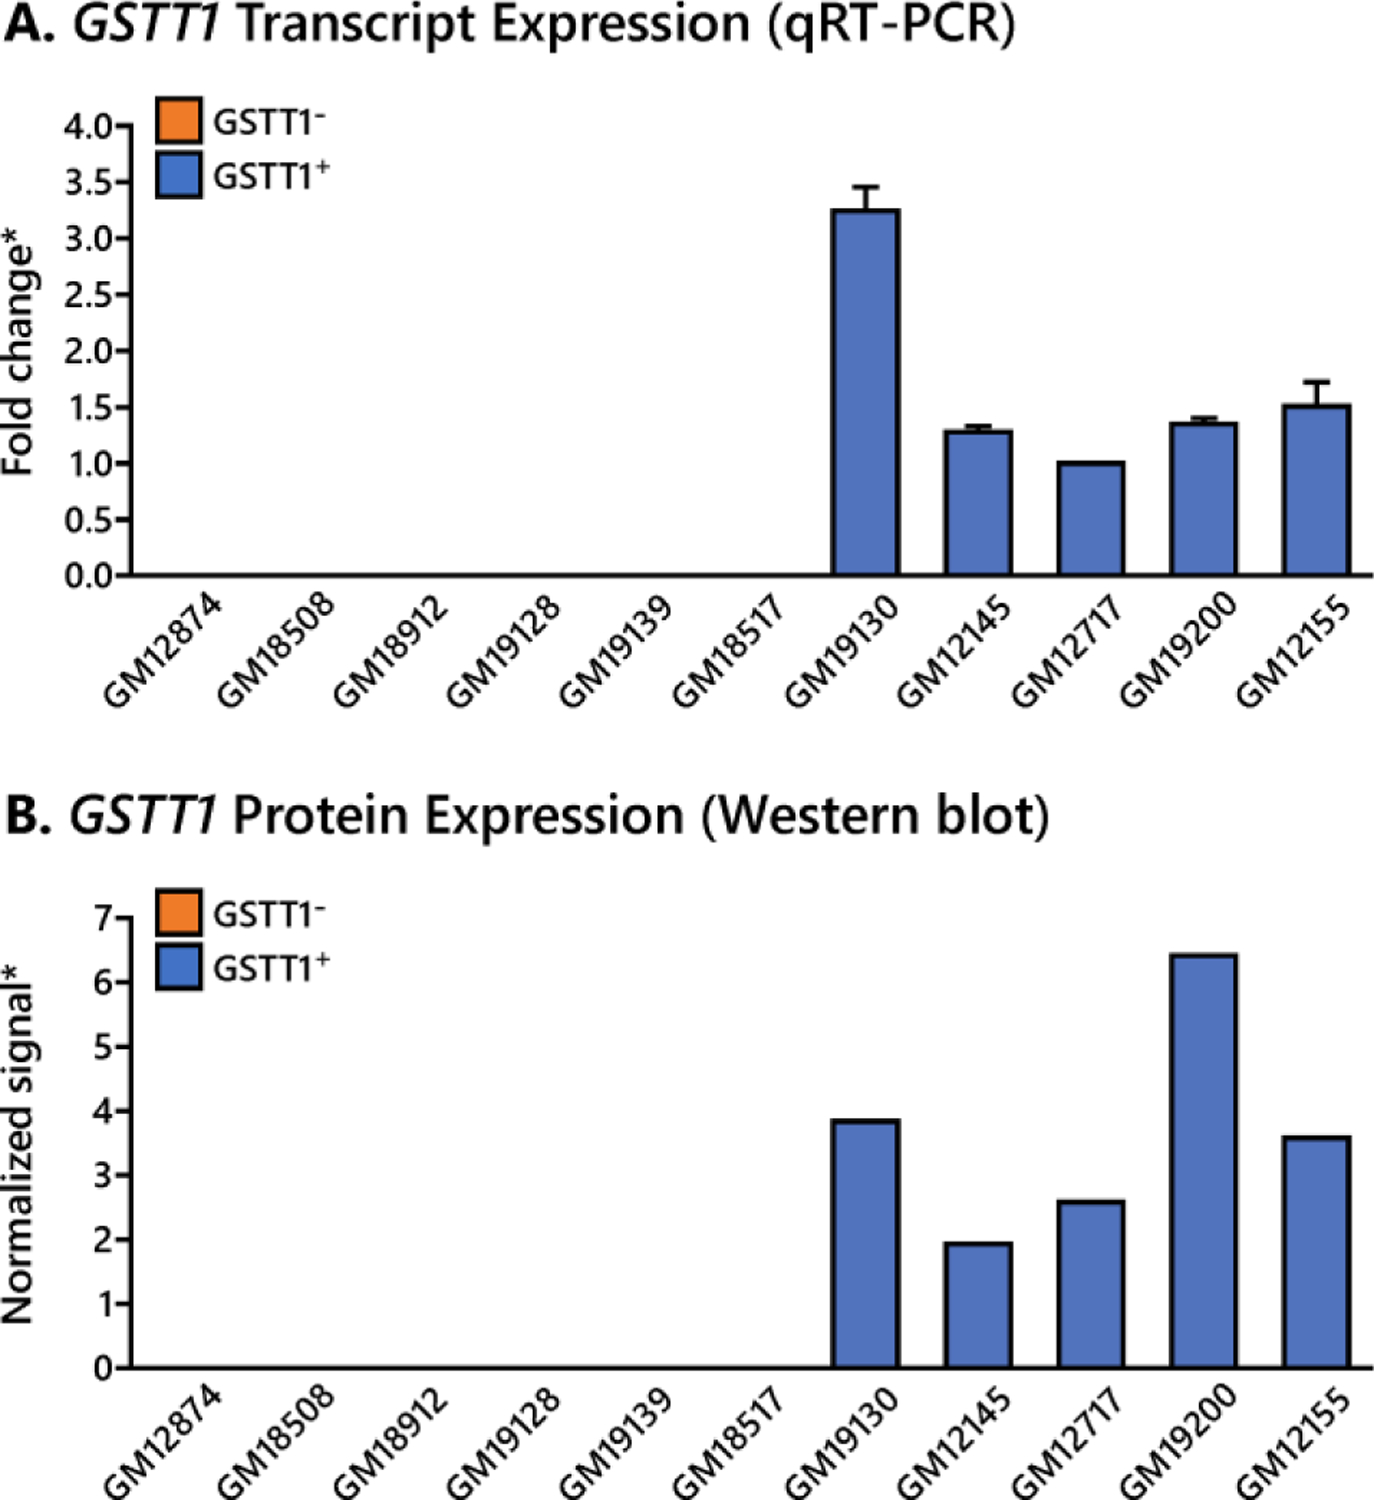
Figure 1.

GSTT1 expression levels in HapMap cells. A. Expression of GSTT1 transcript in selected HapMap cell lines, confirmed by qualitative RT PCR. *Fold change noted with respect to cell line GM12717. B. Expression of GSTT1 protein in selected HapMap cell lines, confirmed by western blot. *Signal intensity normalized to vinculin signal. Values given represent average ± standard deviation.
