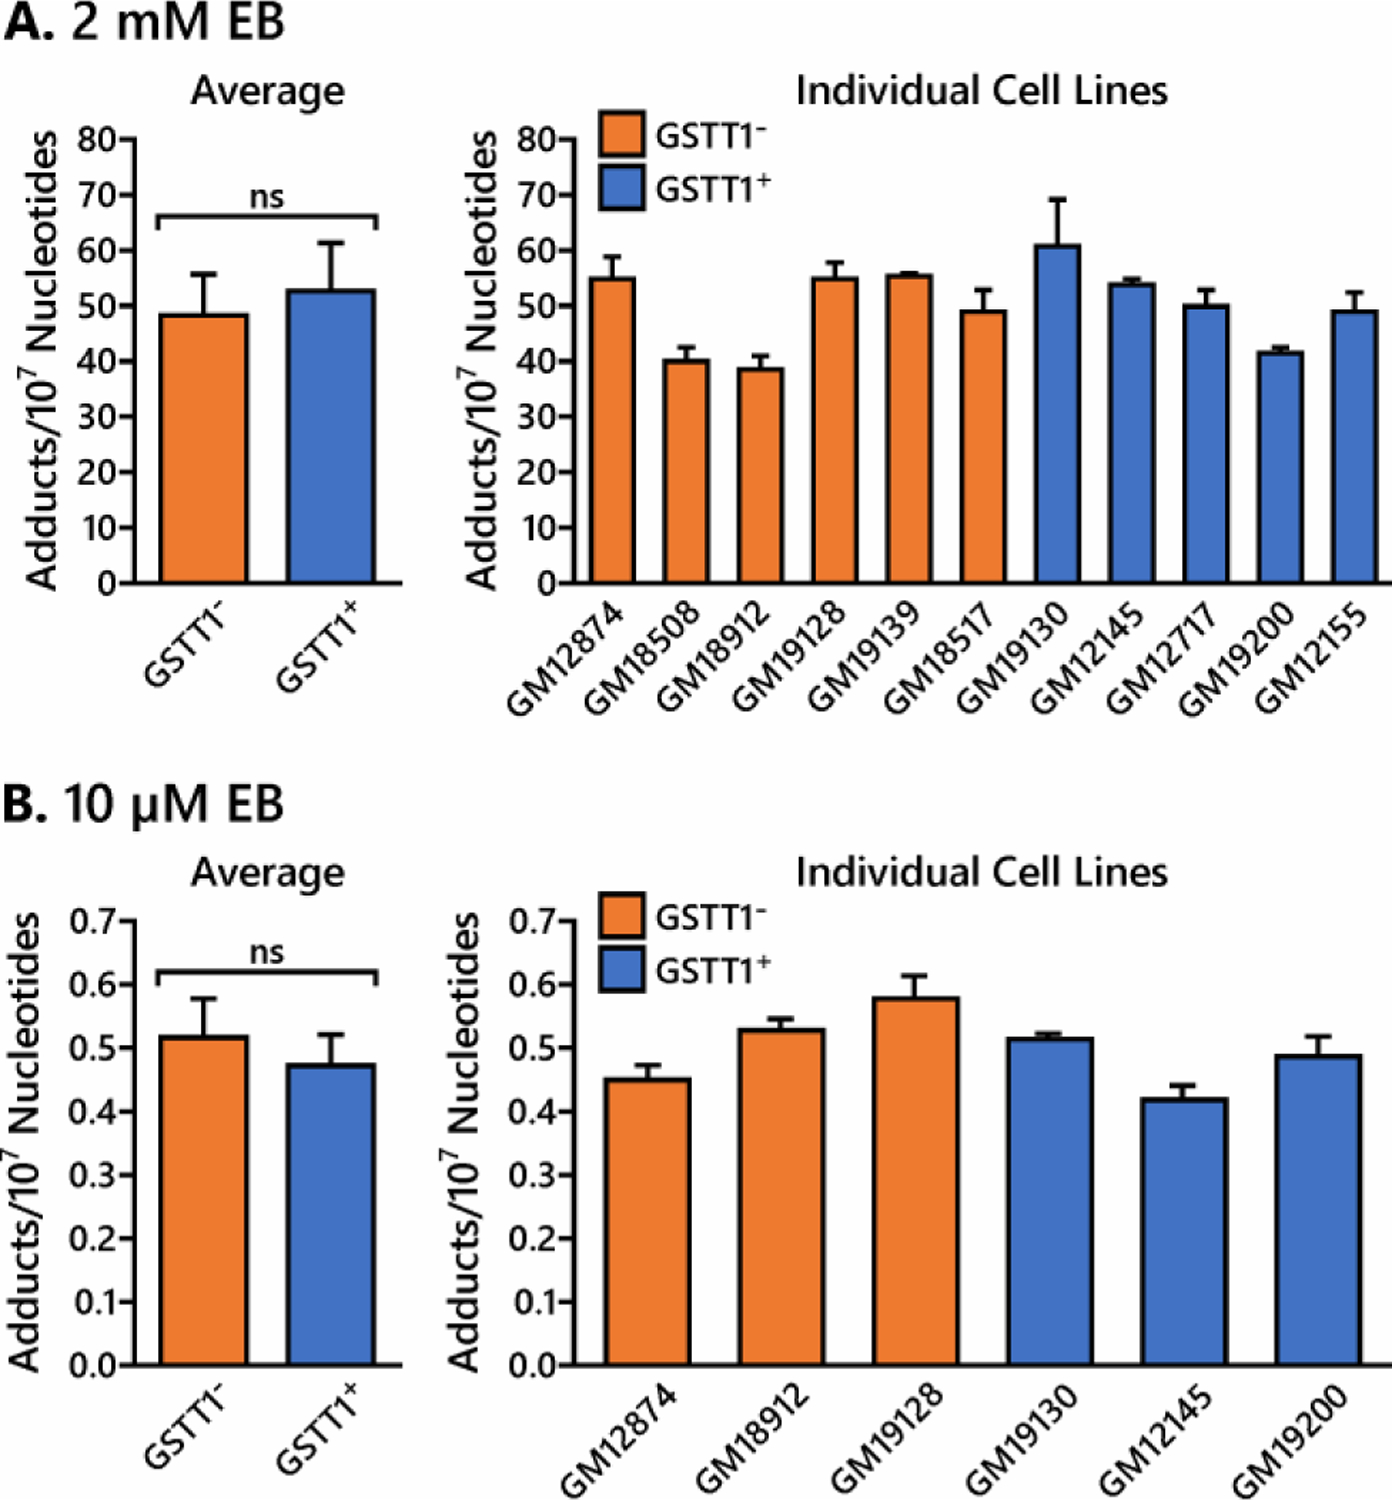
Figure 6.

Quantitation of EB-GII adducts in GSTT1− and GSTT1+ cell lines. HapMap cells (3 million) were treated with 2 mM EB (A) and 10 µM EB (B) for 6 h in triplicate. DNA was extracted and EB-GII adduct levels were quantified by isotope dilution HPLC-ESI-MS/MS. Values represent averages ± standard deviation.
