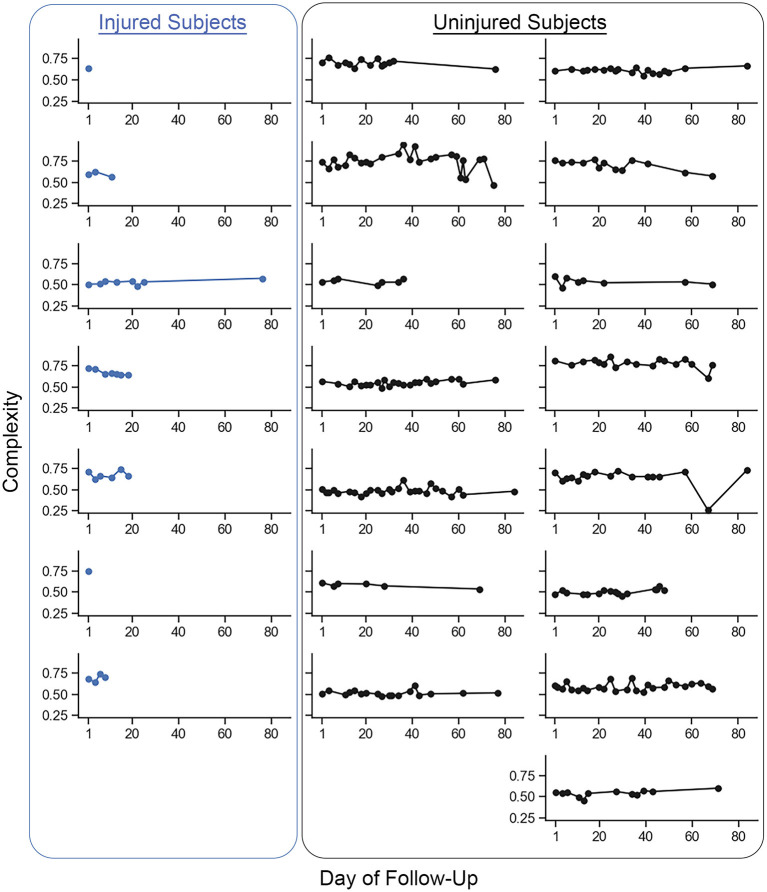
Figure 3.
Individual mean complexity values for each recorded run across participants from the baseline run to the last recorded run. Each dot represents the mean complexity value of a single recorded run from an individual participant. The injured group participants are represented in the column of plots on the left. All other plots are the uninjured group participants. The last recorded run for the injured group was the last run recorded prior to the reported running-related injury (i.e., ‘pre-injury'). Two participants in the injured group reported a running-related injury prior to recording a second run and so only one run is presented. Changes in complexity within participants were small on a per-unit basis (mean ± 1 standard deviation change (i.e., pre-injury minus baseline) in run-to-run complexity within a given participant was −0.0031 ± 0.0085 units. The between-participant standard deviation (0.0871 units) in run-to-run complexity magnitude was more than 60% larger than the within-participant standard deviation (0.0529 units).

