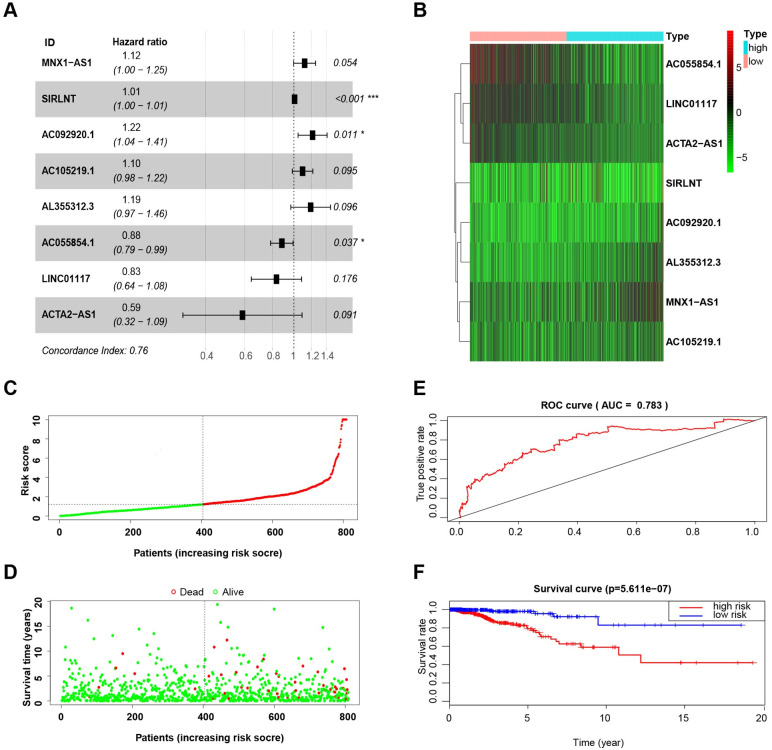
Fig 1. The construction of the 8-lncRNA signature and its performance analysis.
(A) Forest map showing correlation between the expression levels of the 8 lncRNAs and OS in BCa patients. (B) Heatmap showing the expression levels of 8 lncRNAs in BCa patients. (C) Risk scores calculated by the expression levels of the 8 lncRNAs in BCa patients. (D) Patient survival status and follow-up time. (E) ROC curve analyzing the performance of the model using the risk scores. (F) Survival (Kaplan-Meier curve) analysis showing different outcomes between the BCa patients with low-risk and high-risk scores.

