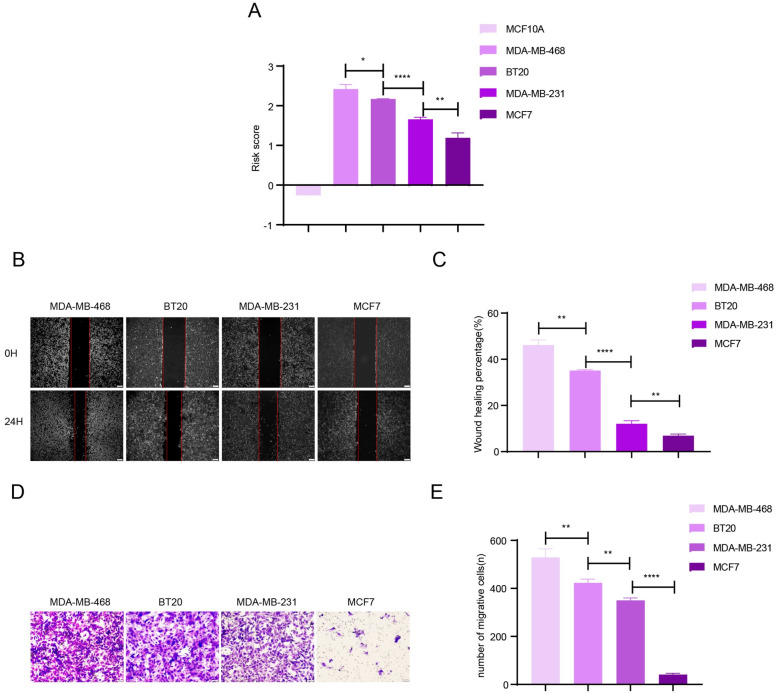
Fig 3. Validation of the risk signature with BCa cell lines.
(A) The risk score calculated by the expression level of the 8 lncRNAs in 5 BCa cell lines. (B)-(E) The results of wound-healing and transwell assays using 4 BCa cell lines. The results showed that the cell lines with a higher risk score display stronger migration activity. Data are expressed as mean ± standard deviation (SD) (n = 3). *p < 0.1, **p < 0.01, ***p < 0.001, ****p < 0.0001.

