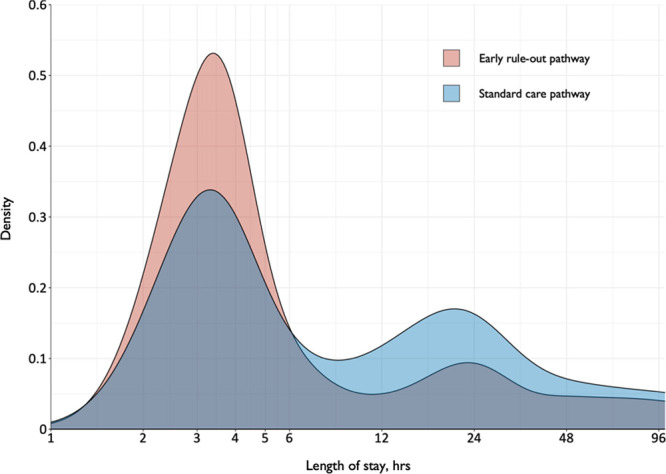
Figure 3.

Length of stay before and after implementation of the early rule-out pathway. Shown is a density plot of the length of stay in patients evaluated before (blue) and after (red) implementation of the early rule-out pathway. hs-cTnI indicates high-sensitivity cardiac troponin I; and STEMI, ST-segment–elevation myocardial infarction.
