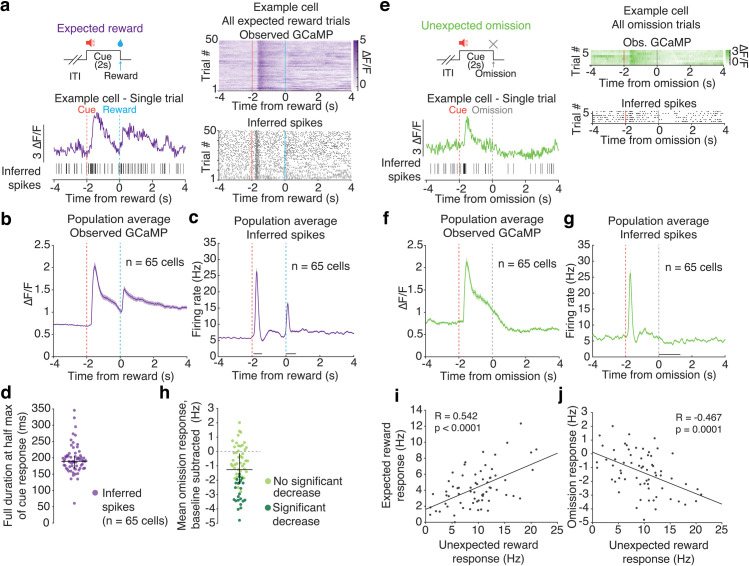
Fig 3. Spike inference applied to Pavlovian conditioning in vivo imaging data recapitulates transient cue responses, pauses following reward omission, and previously reported relationships between expected and unexpected reward responses.
a. Top left: Schematic showing expected reward is delivered after a 2 s cue presentation. Bottom left: Example expected reward trial from a single cell, showing observed GCaMP (purple) and inferred spikes (black vertical lines). Right: All expected reward trials from the example cell, showing observed GCaMP (top) and inferred spikes (bottom). b. Mean observed GCaMP from population around presentation of expected reward. c. Mean inferred spikes from population around presentation of expected reward. d. Full duration at half max of cue response in inferred spikes (median = 189.3 ms, Q1 = 168.3 ms, Q3 = 205.6 ms). Vertical bars are interquartile range (Q1 and Q3). e. Top left: Schematic showing unexpected omission of reward, where reward is omitted after a 2 s cue presentation that previously predicted reward. Bottom left: Example unexpected omission trial from a single cell, showing observed GCaMP (green) and inferred spikes (black vertical lines). Right: All unexpected omission trials from example cell, showing observed GCaMP (top) and inferred spikes (bottom). f. Mean population observed GCaMP around unexpected omission of reward. g. Mean population firing rate from inferred spikes around unexpected omission of reward. Shaded areas are SEM. h. Mean omission response of inferred spikes, where omission response is mean firing rate over 1,300 ms following onset of reward omission, baseline subtracted using the mean firing rate over 1 s period before trial start (median = -1.3 Hz, Q1 = -2.3 Hz, Q3 = -0.1 Hz). Neurons that exhibited a significant decrease in firing following reward omission (22/65 neurons; 33.9% of population) are darker green. Vertical bars are interquartile range (Q1 and Q3). i. Scatterplot of expected reward response versus unexpected reward response, using inferred firing rate of each neuron, recapitulates correlations in Eshel et al. [39]. j. Scatterplot of omission response versus unexpected reward response, using inferred firing rate of each neuron, recapitulates correlations in Eshel et al. [39]. Responses in i and j are baseline subtracted. All data is from cells expressing GCaMP6f.

